

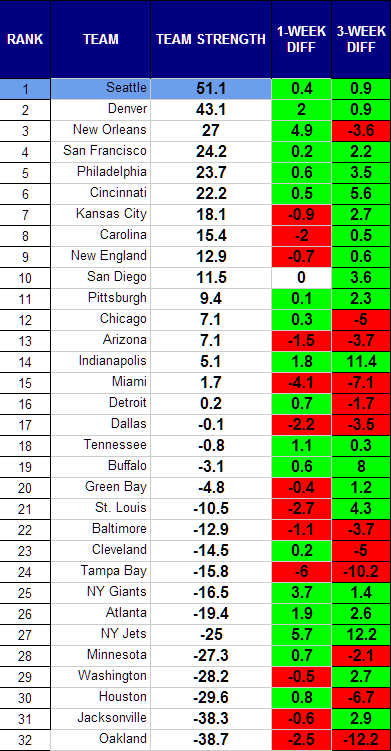
For the second straight season, the Seahawks finish with the top spot in the power rankings. Denver finishes second for back-to-back seasons as well. And San Francisco finishes fourth again. Remarkable consistency for a parity-drive league. You can check out the final rankings from 2012 here.
The formula proved pretty accurate at predicting playoff teams yet again. By week three, 7 of 10 teams in the top ten made the playoffs, and 9 of the top 13. By week four, 8 of the top 10 teams were playoff qualifiers, and 10 of the 12 playoff teams were among the top 15. This is why I trust the numbers more than subjective expert picks.
The lowest ranked team in week four to make the playoffs was the then-23rd-ranked Eagles. Just like the Packers now, it is hard for the numbers to reflect drastic personnel changes like Aaron Rodgers returning does not erase all the weeks of him being absent, even if it makes the team that much better right now. Same for Nick Foles being inserted as a full-time starter much later in the season.
San Francisco boasts a far higher ranking than the Packers, but the difference has to be much less with Rodgers back in. Green Bay reached a Team Strength as high as 20.7 before Rodgers was injured, not far off the 49ers 24.2 right now.
On to the playoffs…
Note: If you are having problems viewing the rankings below, try this link. (Leave a comment if it doesn’t work for you!)
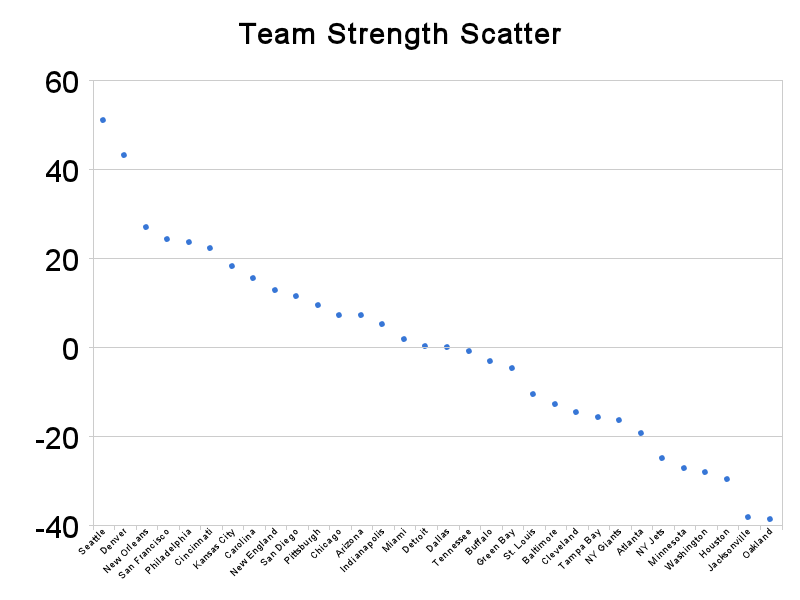
This view helps to give you a view of how teams are grouped together. You will generally see tiers of strength develop as the season wears on.
RANKINGS EXPLAINED
Power rankings are always debatable. I don’t buy into the gut feel methods most places use to determine their rankings, so I developed a formula a few years back that attempts to take at least some of the subjectivity out of the discussion. My approach was simple, I measured offensive and defensive efficiency based on the Yards Per Carry (YPC) and Yards Per Attempt (YPA), as well as points scored and points allowed. The formula to calculate “Team Strength” was as follows:
(YPC (offense) + YPA (offense) + Avg Pts/Game Scored) – (YPC (defense) + YPA (defense)+ Avg Pts/Game Allowed)
The formula has proven to be a pretty accurate predictor of success, but I am always looking for ways to improve it. I read a great article on ColdHardFootballFacts.com. There was one gem in there about predicting championship teams. The article mentioned passer rating differential as the “mother of all stats.” A full 69 of 72 champions have ranked in the Top 10 in this statistic. It is a stat after my own heart, as I believe offensive and defensive efficiency is the key measurable outside of point differential. Turnovers would factor in there as well, but I am not convinced a team has as much control over that. My power rankings use YPA and YPC differentials. I went ahead and replaced the YPA with offensive and defensive passer rating, to give me this:
(YPC (offense) + Passer Rating (offense) + Avg Pts/Game Scored) – (OPP YPC (defense) + OPP Passer Rating (defense)+ OPP Avg Pts/Game)