
Golden Tate may have recovered from popping this mammoth bottle of champagne after the Super Bowl just in time to pop another one in the coming week. Tate stands to make a pretty penny on the open market after emerging as a tough, reliable, explosive and versatile receiver for the Seahawks. It seems almost certain the Seahawks will find the money to keep Tate around unless another team pays a premium he cannot refuse. Tate has made no secret that he wants to come back, and would take a little less money to do so. His girlfriend of three years is from the area. He has a solid relationship with his up-and-coming quarterback. His head coach loves him, and the Seahawks are setup for a long run of championship football. It is understandable that he would find a return appealing. Someone asked me on Twitter the other day how the 5 yr/$22.5M/$8M Guaranteed deal that Riley Cooper signed would relate to what Tate would get. I did not have the time to answer then, and wanted to go a little deeper.
Admittedly, my first reaction was to scoff at the notion that Cooper, in a pass-happy system like Philadelphia’s,would not have much in common with Tate. There are a lot of receivers in the NFL that are known because of the scheme they play in, and would fade-to-black on other squads that pass less often. The opposite is true of the Seahawks, where receivers get 25 chances to catch the ball each game. Efficiency oozed from them. Put them on a pass-first squad, and their production and reputation would soar. Cooper became a name this year after his team started passing 40+ times each game. Or so I thought…
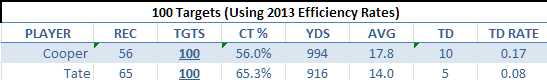
It turns out that the Eagles ranked 27th in the NFL in pass attempts per game at 31.8, only five more per game than the 31st-ranked Seahawks (26.8 att/gm). The next place I wanted to look was their efficiency numbers. Namely, catch rate, yards per catch and touchdown rate.
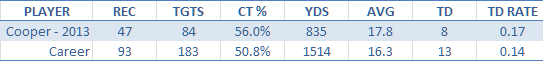
You can see that Cooper certainly had a career year in 2013. He and Tate were both drafted in 2010, but Cooper got over half his career receptions last season. He had never been targeted more than 47 times in a year before basically doubling that with his friend Nick Foles throwing it to him. What I look for in these situations is did a player sustain and/or increase their efficiency numbers as they were targeted more, or were they more a product of pure volume? Cooper’s catch rate took a noticeable bump this year, as did his yards per catch and touchdown rate. A 0.17 touchdown rate is pretty insane. Demaryius Thomas led all WRs in touchdowns this year, and his TD rate was 0.15. Again, TD rate is touchdowns divided by receptions, and it gives you an idea of how often the receiver scores. Remember when people used to say all Cris Carter did was catch touchdowns as an Eagle back in the day? He rang up a 0.24 TD rate in 1989 when he pulled in 11 TDs with just 45 catches. Cooper’s catch rate, while up, is still below average. Let’s take a look at Tate to see how he compares.
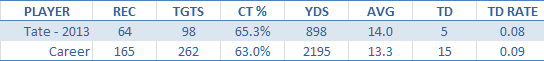
Tate also had a career year in 2013. Although, he had more success prior to this season, so his career numbers dwarf Cooper’s. A few things stand out to me:
- Tate actually had 14 more targets last year than Cooper
- His catch rate is significantly higher than Cooper’s
- His yards per catch and TD rate are significantly lower