


Some things have changed over the nearly fifty years of Super Bowls. Some things have stayed the same. Take a look at how the winners of the ultimate prize have performed each decade since the 1960s.
Scoring dominance not required
Take a look at the following two charts. The first shows what Super Bowl winning teams averaged in terms of points scored and points allowed per game during their regular seasons. The second shows there those teams ranked, on average, in points scored and points allowed. As always for rankings, the lower the number, the better.
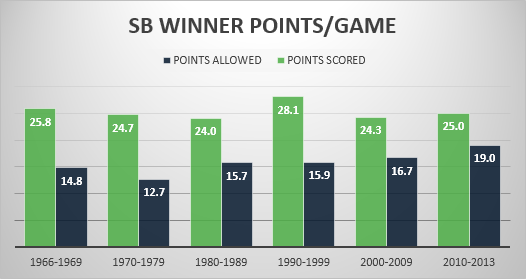
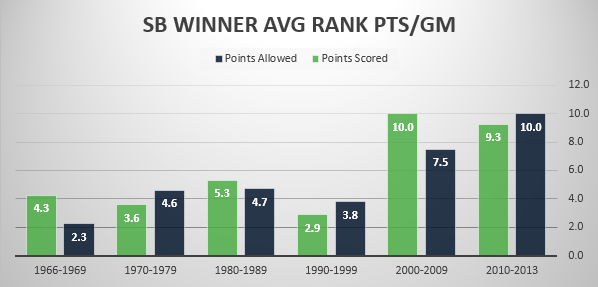
This absolute and relative view into the trends help us see that scoring has actually been mostly stable through the years. Super Bowl winners in the 60s averaged 25.8 ppg and the last four winners from 2010-2013 averaged 25.0 ppg. The 90s produced higher scoring winners when they popped to 28.1 ppg, but all the other decades are pretty stable. Looking at the ranking, though, tells us that less dominant scoring teams have been able to win starting in the new millenium. For four different decades, teams needed to be a top five scoring team to win it all. That has dropped to a top ten scoring team the last fourteen seasons.
The story is similar on defense. Although, points allowed per game has been on a steady rise, and is on pace to be far higher this decade than any other. Rankings on defense are also tracking to the same trend as teams have dropped from top five to top ten.
Balance remains key in every decade where rankings in points scored and points allowed are always similar
This decade is seeing the smallest spread between points scored and points allowed among winners (+6.0 ppg). The typical spread is at least +10 ppg, peaking in the 90s when winners managed to outcore opponents 28.1-15.9 for a +12.1 ppg advantage. It appears that there have been less dominant teams since 2000, or it simply requires less dominance to win a championship than it used to.
Defenses are struggling


Again we see that balance remains important. In nearly every decade, champions featured teams with similarly ranked offenses and defenses. We also see that the yardage advantage has narrowed.
Passing yards climb

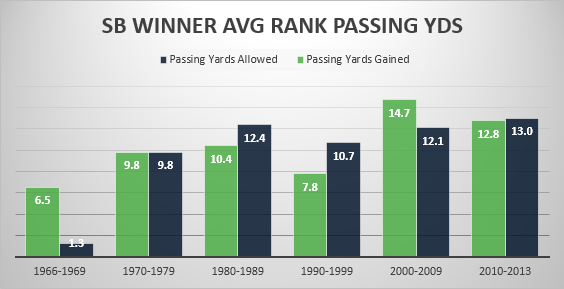
The crazy thing about the rise in passing yards is that even though these teams are averaging more than any Super Bowl winners in history, they are more pedestrian compared to their peers of that era. These teams are ranking, on average, between 10-15 in passing offense and passing defense the last fourteen years.
Running game nears extinction
One of the clearest trends is occurring with rushing yards. There has been a steady decline in both the amount of rushing yards gained and the rank of rushing offenses for winners since the 70s. Oddly, the rushing defenses of these teams are steadily allowing more yards the last three decades. It has now reached a point where, for the first time, Super Bowl winners the last four seasons have allowed an average of more rushing yards than they gained.
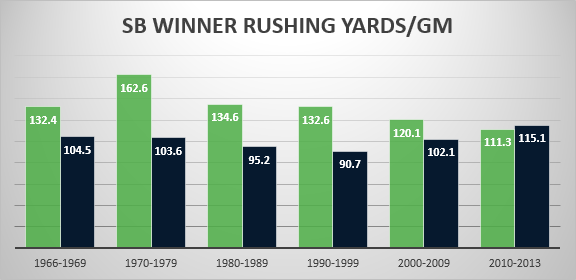

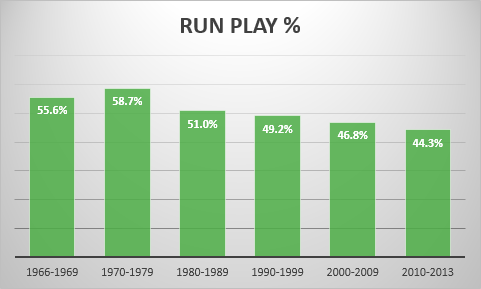
The run play percentage tells the story best. Teams like the Steelers and the Dolphins in the 70s led a heavy run-oriented attack that accounted for nearly 60% of their plays on the ground. The last four winners have a combined 56% of their plays going through the air. Seattle broke this trend with 52% of their plays being runs last season, which has the highest since 2005 for a winner, and second-highest in the last 23 years.
Turnover margin still reigns supreme
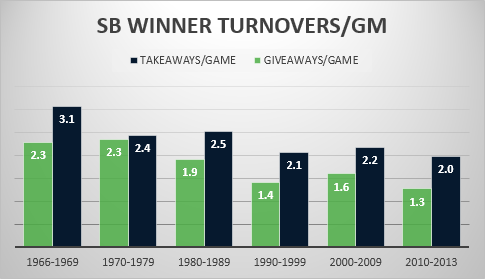

![]()