
Denver is in danger of losing their grip on the top spot for the first time in weeks as Green Bay trounced the Bears and the Broncos saw their strength of schedule (SOS) drop after playing the winless Raiders. The 49ers and Cardinals, by this measure, are in a different class than the Seahawks.
The Seahawks had been held back by a porous pass defense allowing a very high passer rating, but that has started to drop. They are now struggling with an offense that is seeing the passer rating drop faster than their opponents. Both the Cardinals and the 49ers have a higher passer rating on offense and allow a lower one on defense than the Seahawks.
Those of you who read my rankings regularly know I tweak the formula as I see issues crop up. This is the first year I have factored in SOS. I have liked the result for the most part, but it is starting to produce some odd results. The one that really stands out is the NY Giants being ninth this week. As a result, I have decided to post the rankings without SOS below as well for comparison.
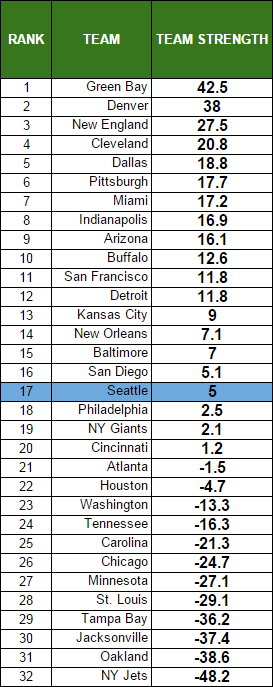
RANKINGS (WITH SOS)

RANKINGS (WITHOUT SOS)
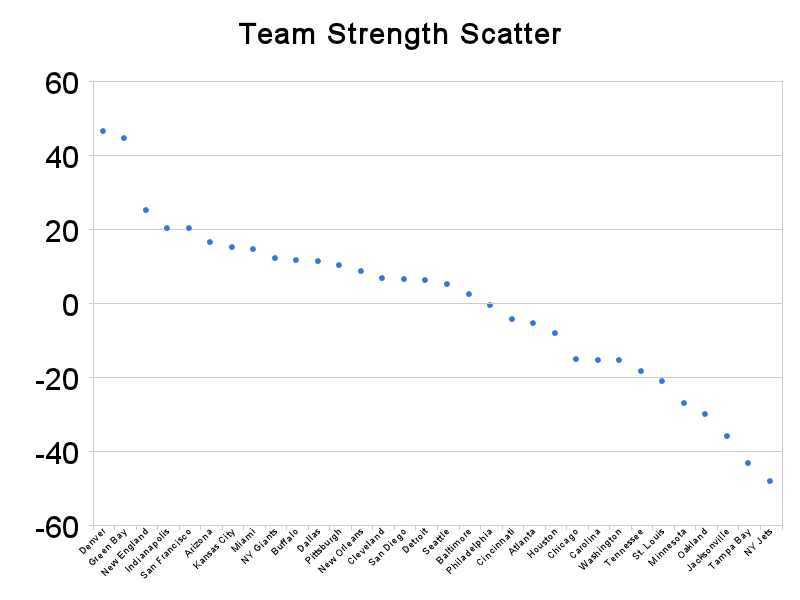
Scatter
This view helps to give you a view of how teams are grouped together. You will generally see tiers of strength develop as the season wears on.
.png)
RANKINGS EXPLAINED
Power rankings are always debatable. I don’t buy into the gut feel methods most places use to determine their rankings, so I developed a formula a few years back that attempts to take at least some of the subjectivity out of the discussion. My approach was simple, I measured offensive and defensive efficiency based on the Yards Per Carry (YPC) and Yards Per Attempt (YPA), as well as points scored and points allowed. The formula to calculate “Team Strength” was as follows:
(YPC (offense) + YPA (offense) + Avg Pts/Game Scored) – (YPC (defense) + YPA (defense)+ Avg Pts/Game Allowed)
The formula has proven to be a pretty accurate predictor of success, but I am always looking for ways to improve it. I read a great article on ColdHardFootballFacts.com. There was one gem in there about predicting championship teams. The article mentioned passer rating differential as the “mother of all stats.” A full 69 of 72 champions have ranked in the Top 10 in this statistic. It is a stat after my own heart, as I believe offensive and defensive efficiency is the key measurable outside of point differential. Turnovers would factor in there as well, but I am not convinced a team has as much control over that. My power rankings use YPA and YPC differentials. I went ahead and replaced the YPA with offensive and defensive passer rating, to give me this:
(YPC (offense) + Passer Rating (offense) + Avg Pts/Game Scored) – (OPP YPC (defense) + OPP Passer Rating (defense)+ OPP Avg Pts/Game)
As of September 23, 2014, I have added a strength of schedule component to the rankings as well.
![]()
