

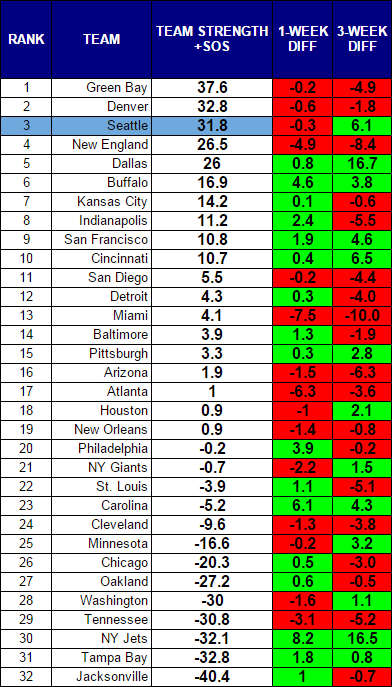
The Packers end the season on top of the power rankings, followed by the Broncos and the Seahawks. Of the top five teams, only the Seahawks and Cowboys enter the playoffs having improved their rankings over the past three weeks. In fact, only the Dolphins have lost more team strength the last three weeks than the Patriots.
The Seahawks had the second toughest schedule in the NFL, according to TeamRankings.com. Dallas is the hardest charging team entering the playoffs, having gained 16.7 points of team strength in the last three weeks. The Bills are the highest ranked team (#6) to not make the playoffs. It should not be a surprise to hear the Panthers (#23) are the lowest ranked team to sneak in.
And, as usual, the rankings system was pretty accurate early in the year. Seven of the ten teams ranked in the top ten after week three made the playoffs this year.
RANKINGS (WITH SOS)
RANKINGS (WITHOUT SOS)

Scatter
This view helps to give you a view of how teams are grouped together. You will generally see tiers of strength develop as the season wears on.
.png)
RANKINGS EXPLAINED
Power rankings are always debatable. I don’t buy into the gut feel methods most places use to determine their rankings, so I developed a formula a few years back that attempts to take at least some of the subjectivity out of the discussion. My approach was simple, I measured offensive and defensive efficiency based on the Yards Per Carry (YPC) and Yards Per Attempt (YPA), as well as points scored and points allowed. The formula to calculate “Team Strength” was as follows:
(YPC (offense) + YPA (offense) + Avg Pts/Game Scored) – (YPC (defense) + YPA (defense)+ Avg Pts/Game Allowed)
The formula has proven to be a pretty accurate predictor of success, but I am always looking for ways to improve it. I read a great article on ColdHardFootballFacts.com. There was one gem in there about predicting championship teams. The article mentioned passer rating differential as the “mother of all stats.” A full 69 of 72 champions have ranked in the Top 10 in this statistic. It is a stat after my own heart, as I believe offensive and defensive efficiency is the key measurable outside of point differential. Turnovers would factor in there as well, but I am not convinced a team has as much control over that. My power rankings use YPA and YPC differentials. I went ahead and replaced the YPA with offensive and defensive passer rating, to give me this:
(YPC (offense) + Passer Rating (offense) + Avg Pts/Game Scored) – (OPP YPC (defense) + OPP Passer Rating (defense)+ OPP Avg Pts/Game)
As of September 23, 2014, I have added a strength of schedule component to the rankings as well.
![]()
