

SEAHAWKS CONTINUE CLIMB, REACH #3
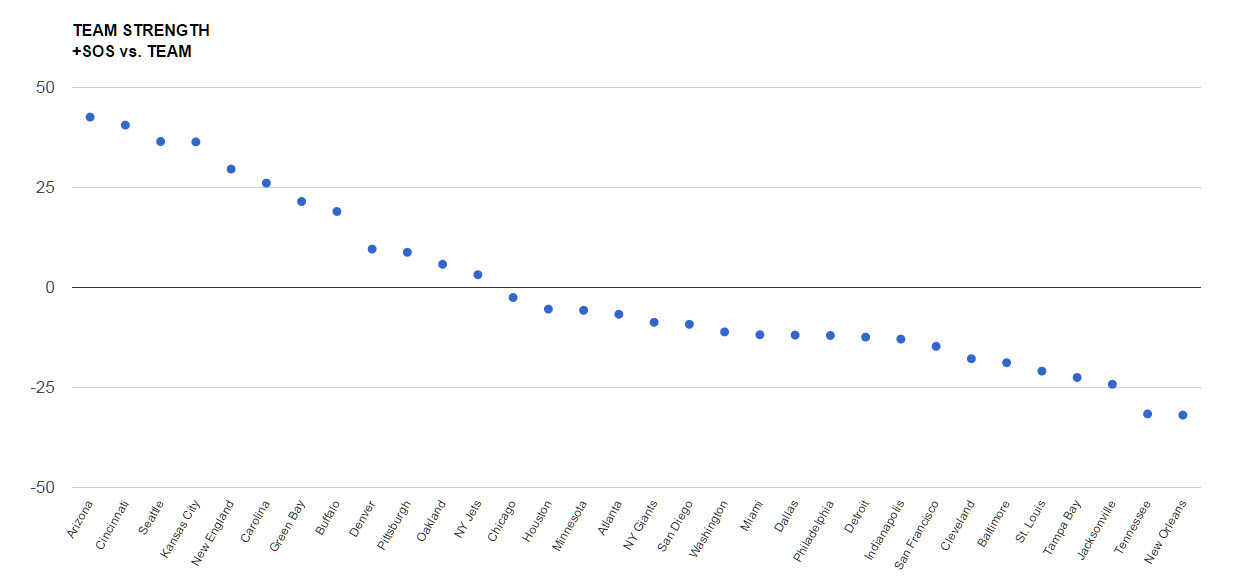
The Cardinals are tops, and for good reason. They have been the most consistent team all year, and are strong across the board. Cincinnati has been gaining steam, and is in the same tier as Arizona. Seattle and Kansas City are in the second tier, right behind the leaders. New England has tumbled all the way down to a third tier team to round out the top five. Carolina continues to be weighed down by a weak SOS and a lowish passer rating. Crazy to think that the Seahawks have had fourth quarter leads over four of the top seven team.
RANKINGS (WITH SOS)

Scatter
This view helps to give you a view of how teams are grouped together. You will generally see tiers of strength develop as the season wears on.
RANKINGS EXPLAINED
Power rankings are always debatable. I don’t buy into the gut feel methods most places use to determine their rankings, so I developed a formula a few years back that attempts to take at least some of the subjectivity out of the discussion. My approach was simple, I measured offensive and defensive efficiency based on the Yards Per Carry (YPC) and Yards Per Attempt (YPA), as well as points scored and points allowed. The formula to calculate “Team Strength” was as follows:
(YPC (offense) + YPA (offense) + Avg Pts/Game Scored) – (YPC (defense) + YPA (defense)+ Avg Pts/Game Allowed)
The formula has proven to be a pretty accurate predictor of success, but I am always looking for ways to improve it. I read a great article on ColdHardFootballFacts.com. There was one gem in there about predicting championship teams. The article mentioned passer rating differential as the “mother of all stats.” A full 69 of 72 champions have ranked in the Top 10 in this statistic. It is a stat after my own heart, as I believe offensive and defensive efficiency is the key measurable outside of point differential. Turnovers would factor in there as well, but I am not convinced a team has as much control over that. My power rankings use YPA and YPC differentials. I went ahead and replaced the YPA with offensive and defensive passer rating, to give me this:
(YPC (offense) + Passer Rating (offense) + Avg Pts/Game Scored) – (OPP YPC (defense) + OPP Passer Rating (defense)+ OPP Avg Pts/Game)
As of September 23, 2014, I have added a strength of schedule component to the rankings as well.
![]()
