
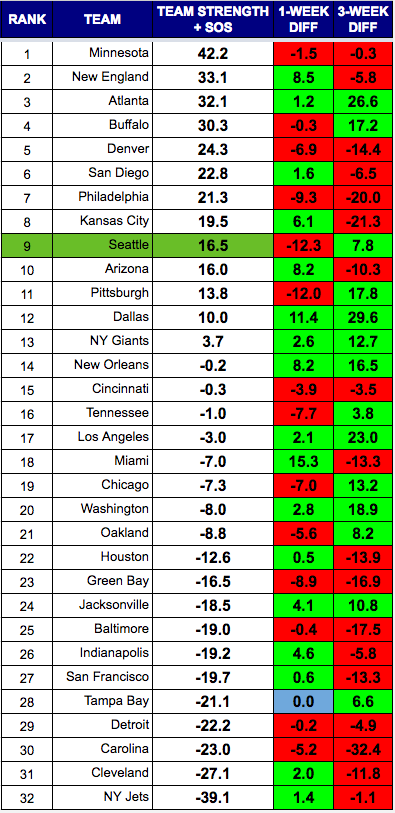
POWER RANKINGS
Atlanta Falcons fans can take some solace in their loss as our power rankings saw their performance this week as an improvement. They rise to 3rd in the rankings, on the back of the league’s most potent offense, an improving defense, and one of the league’s toughest strength of schedules (SOS) thus far.
Seattle, on the other hand, continues to be dragged down by the worst SOS in the league. That will not be an issue soon, as the Seahawks are in the midst of arguably the most challenging stretch that any team will face all year.
- #3 Atlanta (W 26-24)
- #10 @ Arizona
- #14 @ New Orleans
- #4 Buffalo
- #2 @ New England
- #7 Philadelphia
Arizona and Seattle are roughly equivalent in the rankings despite vastly different numbers. The Cardinals have been oddly inefficient in the passing game with a passer rating of 77.2, very strong in the run game, and mediocre in run defense. Seattle has been the opposite. If you strip out SOS, Seattle gets separation (27.0 – 20.0), which indicates the Seahawks have been a fundamentally better team to this point.
The Patriots are on the prowl for the top spot where they really belong. Buffalo continues to hold their ground in the top five, and the Chargers remain an enigma that easily could be the talk of the league had they not blown a couple close games they had well in hand. The Eagles fell back to earth in Washington, and may not be the powerhouse some saw to start the year.
An interesting one is Dallas, still outside the top ten despite their 5-1 record. Their offense is great, but the defense is giving up a 95.0 passer rating and 4.4 yards per carry. They also have one of the worst SOS scores in the NFL. Unlike Seattle, that will not change much given the weak division they play in.
Rankings
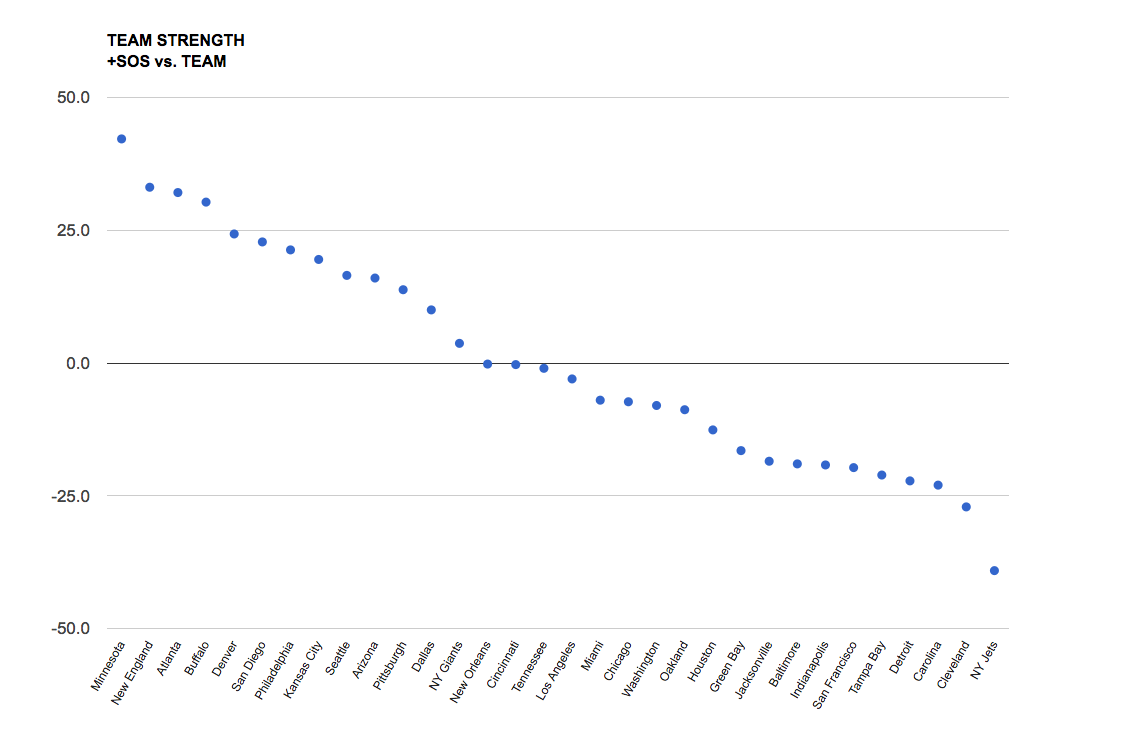
Scatter chart
I like this view as it shows tiers of strength that develop over the course of the season.
RANKINGS EXPLAINED
Power rankings are always debatable. I don’t buy into the gut feel methods most places use to determine their rankings, so I developed a formula a few years back that attempts to take at least some of the subjectivity out of the discussion. My approach was simple, I measured offensive and defensive efficiency based on the Yards Per Carry (YPC) and Yards Per Attempt (YPA), as well as points scored and points allowed. The formula to calculate “Team Strength” was as follows:
(YPC (offense) + YPA (offense) + Avg Pts/Game Scored) – (YPC (defense) + YPA (defense)+ Avg Pts/Game Allowed)
The formula has proven to be a pretty accurate predictor of success (roughly 70% of the teams ranked in the Top 10 by week 3 make the playoffs), but I am always looking for ways to improve it. I read a great article on ColdHardFootballFacts.com. There was one gem in there about predicting championship teams. The article mentioned passer rating differential as the “mother of all stats.” A full 69 of 72 champions have ranked in the Top 10 in this statistic. It is a stat after my own heart, as I believe offensive and defensive efficiency is the key measurable outside of point differential. Turnovers would factor in there as well, but I am not convinced a team has as much control over that. My power rankings use YPA and YPC differentials. I went ahead and replaced the YPA with offensive and defensive passer rating, to give me this:
(YPC (offense) + Passer Rating (offense) + Avg Pts/Game Scored) – (OPP YPC (defense) + OPP Passer Rating (defense)+ OPP Avg Pts/Game)