
POWER RANKINGS
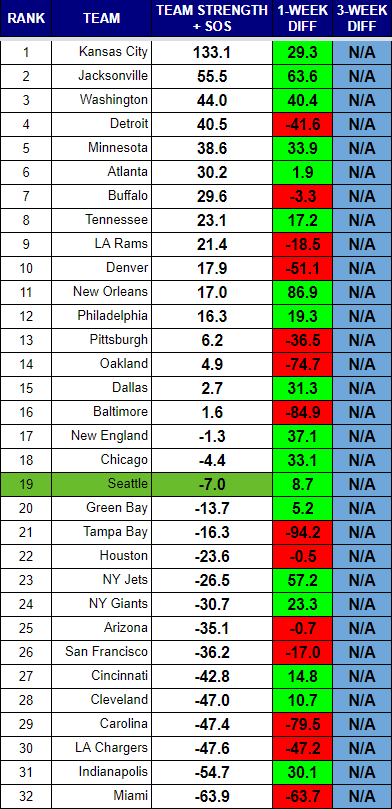
Through three weeks of the season, there is little doubt which team deserves the top spot in the power rankings. The Chiefs not only have won every game, but have faced one of the toughest schedules so far. Only New Orleans and Houston have had tougher competition. The Chiefs boast the best offense in football by a massive margin, with a sterling 132.7 passer rating, a gaudy 6.8 yards per carry, and 31.0 points per game. Their defense is also among the best. Only their run defense is a little suspect.
Jacksonville vaults into the second spot on the strength of two blowouts in three games, and their only loss coming against the 8th-ranked Titans. Their defense is third in the league by my measures, with a fantastic 59.6 opponent passer rating. Only the Ravens are better (58.5). Washington is another upstart at the top of the rankings. Balanced offensively and defensively, the Redskins are one of the toughest teams in the NFL to run on (3.2 opponent YPC). They also have a nice 105.3 passer rating and 4.5 YPC on offense.
Surprises further down the rankings include the Falcons coming in at #6 despite being the only undefeated team in the NFC. Their offense has been strong, but not as strong as last season, and their defense has been weaker than many predicted. They are allowing an 86.0 passer rating, 4.8 yards per carry, and 22.0 points per game. They would actually rank lower if not for a strong SOS this far.
The Bills seem higher than they should be, but their defense has been the best in football per this formula, allowing just a 64.9 passer rating, 3.4 YPC and 12.3 points per game. The Rams have one of the strongest offenses in the league thus far, but a porous defense and the league’s easiest schedule to date. They would be ranked 3rd if not for their SOS score dragging them down.
Perhaps most surprising to folks is the Patriots showing up at #17. While their offense is terrific, their defense has been the worst in the NFL thus far. They are allowing a 112.7 passer rating, 5.1 yards per carry, and 31.7 points per game. They made a terrible Texans offense look competent on Sunday.
Seattle remains stuck at #19, which feels about right. They are mediocre on offense and defense so far.
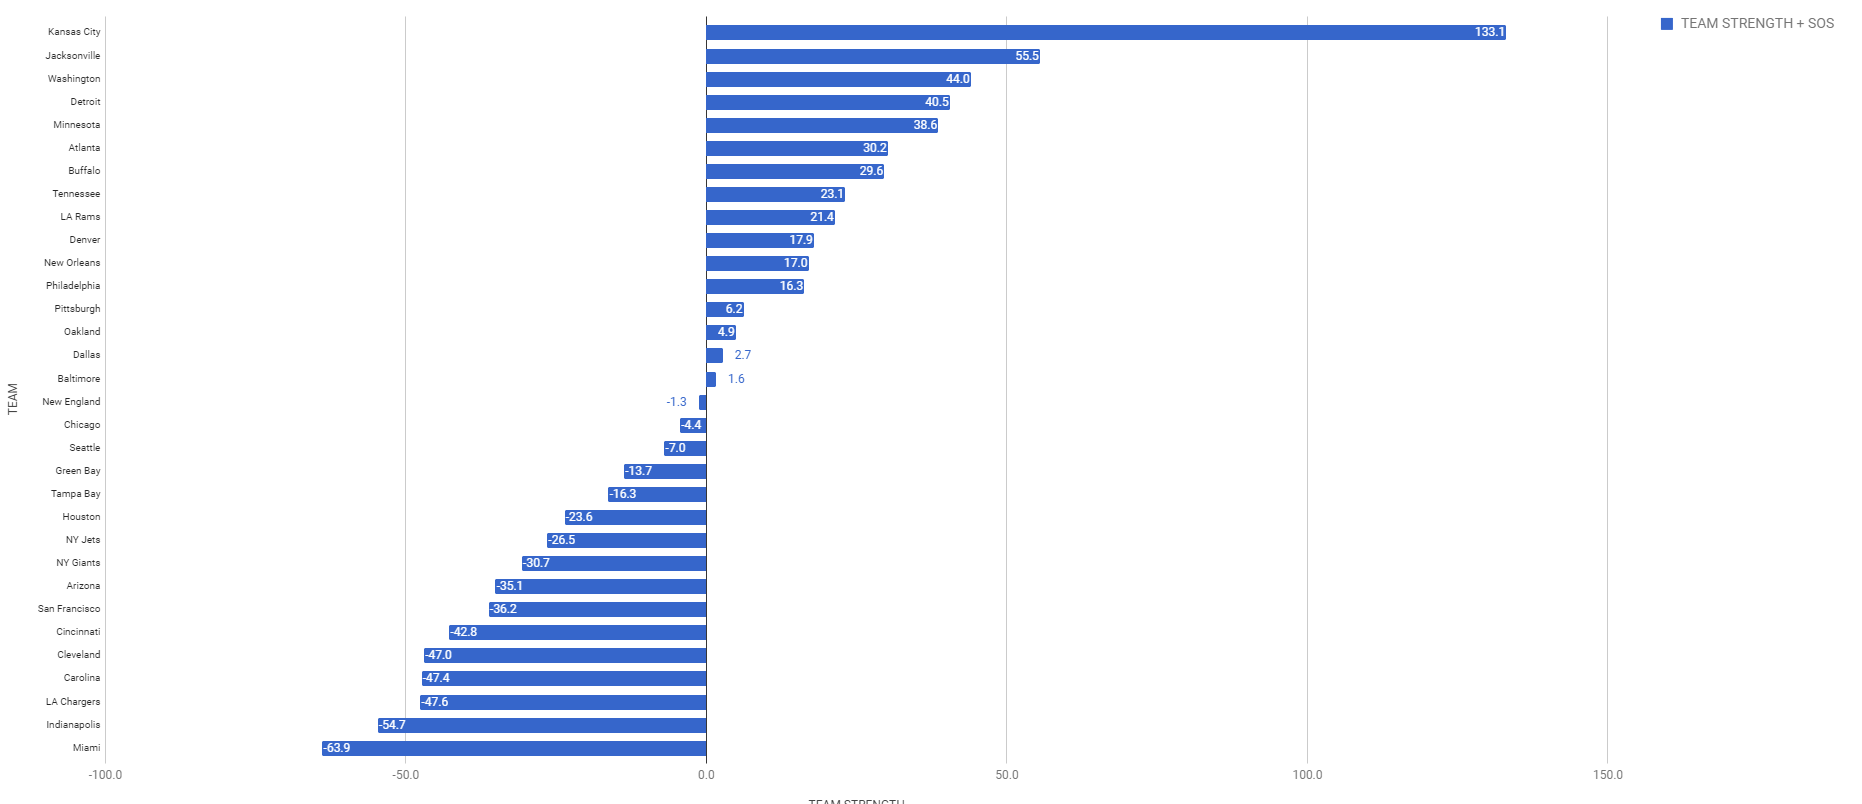
Rankings Visualization
I like this view as it shows tiers of strength that develop over the course of the season.
RANKINGS EXPLAINED
Power rankings are always debatable. I don’t buy into the gut feel methods most places use to determine their rankings, so I developed a formula a few years back that attempts to take at least some of the subjectivity out of the discussion. My approach was simple, I measured offensive and defensive efficiency based on the Yards Per Carry (YPC) and Yards Per Attempt (YPA), as well as points scored and points allowed. The formula to calculate “Team Strength” was as follows:
(YPC (offense) + YPA (offense) + Avg Pts/Game Scored) – (YPC (defense) + YPA (defense)+ Avg Pts/Game Allowed)
The formula has proven to be a pretty accurate predictor of success (roughly 70% of the teams ranked in the Top 10 by week 3 make the playoffs), but I am always looking for ways to improve it. I read a great article on ColdHardFootballFacts.com. There was one gem in there about predicting championship teams. The article mentioned passer rating differential as the “mother of all stats.” A full 69 of 72 champions have ranked in the Top 10 in this statistic. It is a stat after my own heart, as I believe offensive and defensive efficiency is the key measurable outside of point differential. Turnovers would factor in there as well, but I am not convinced a team has as much control over that. My power rankings use YPA and YPC differentials. I went ahead and replaced the YPA with offensive and defensive passer rating, to give me this:
(YPC (offense) + Passer Rating (offense) + Avg Pts/Game Scored) – (OPP YPC (defense) + OPP Passer Rating (defense)+ OPP Avg Pts/Game)