
POWER RANKINGS
Philadelphia, New Orleans, Los Angeles, Minnesota, Jacksonville, and Kansas City have formed an elite tier among the NFL. They all hover around 40 in team strength or higher. It may be that there is a separation after the first four. Jacksonville, though, has gained more team strength over the past three weeks than any other top ten team. Blake Bortles has played three straight stellar games, and that defense continues to look like the best unit in the NFL. The Rams just played their best game of the season and are arguably the most complete team in football when all three phases are accounted for.
All the Vikings continue to do is win. Drew Brees is the best quarterback among the top teams, which tends to matter even more come playoff time. New England knows that, and are waiting in the wings after winning a game they had no business winning in Pittsburgh. The Patriots are allowing almost 5.0 yards per carry and over 90 in passer rating. That defense seems too flawed to support a championship run, but Tom Brady has a way of covering up significant flaws.
The Chiefs have recovered a bit. The rankings formula liked them the whole time, even when they were losing. Their offense is still potent. Baltimore continues to climb, and will be a tough out with that defense.

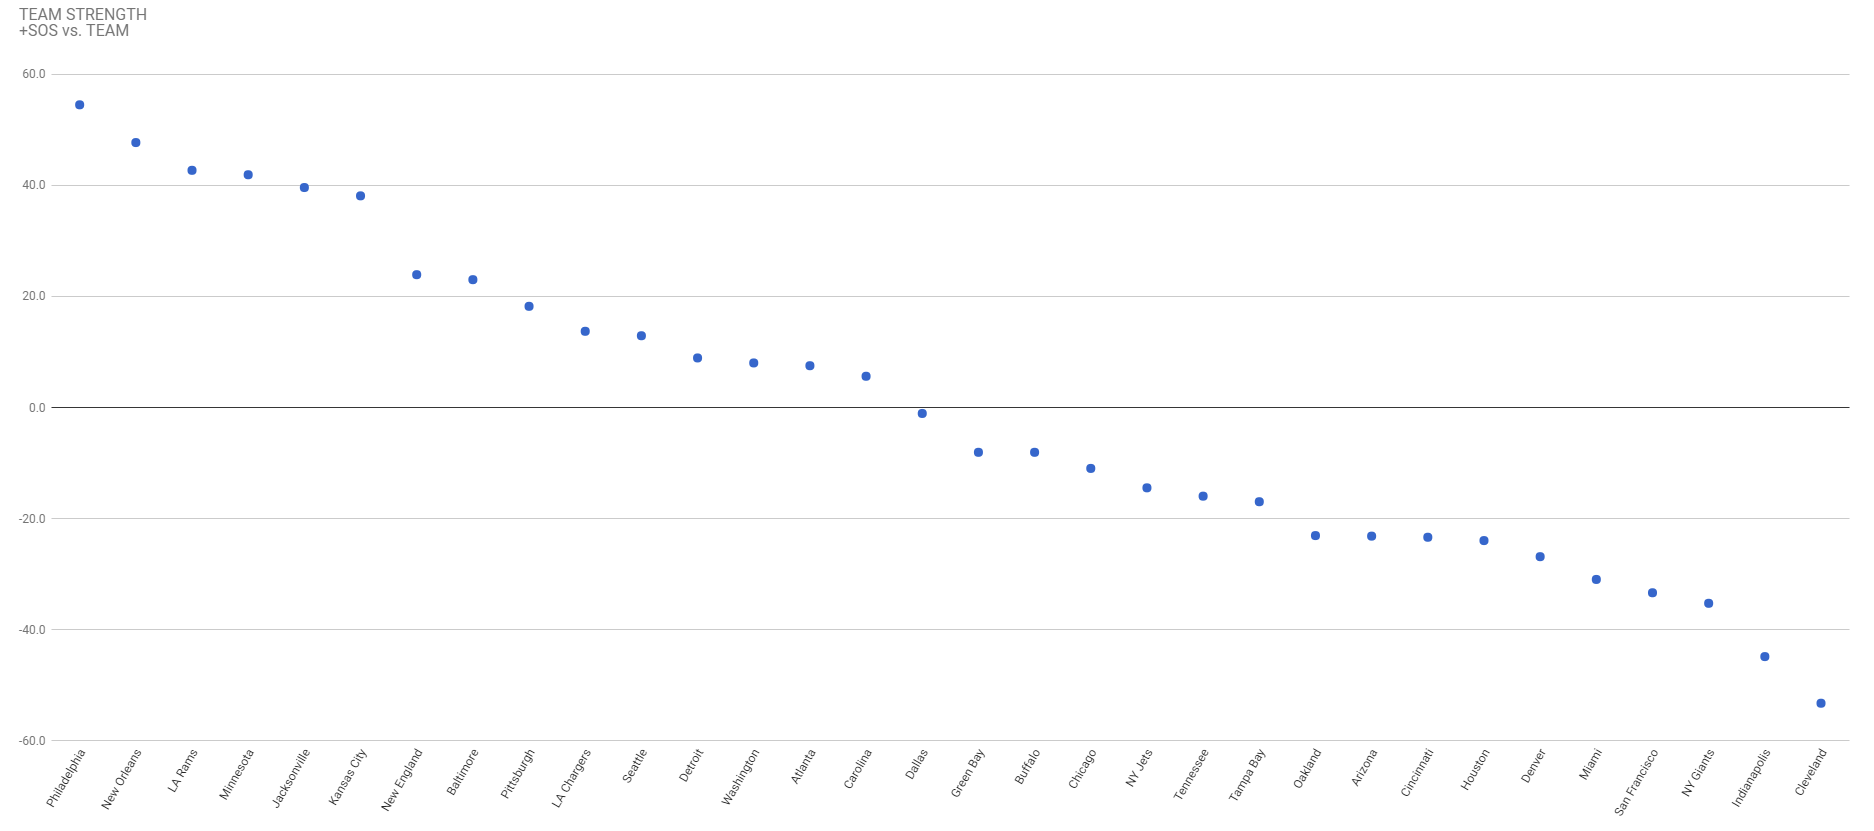
Rankings Visualization
This view shows tiers of strength that develop over the course of the season.
RANKINGS EXPLAINED
Power rankings are always debatable. I don’t buy into the gut feel methods most places use to determine their rankings, so I developed a formula a few years back that attempts to take at least some of the subjectivity out of the discussion. My approach was simple, I measured offensive and defensive efficiency based on the Yards Per Carry (YPC) and Yards Per Attempt (YPA), as well as points scored and points allowed. The formula to calculate “Team Strength” was as follows:
(YPC (offense) + YPA (offense) + Avg Pts/Game Scored) – (YPC (defense) + YPA (defense)+ Avg Pts/Game Allowed)
The formula has proven to be a pretty accurate predictor of success (roughly 70% of the teams ranked in the Top 10 by week 3 make the playoffs), but I am always looking for ways to improve it. I read a great article on ColdHardFootballFacts.com. There was one gem in there about predicting championship teams. The article mentioned passer rating differential as the “mother of all stats.” A full 69 of 72 champions have ranked in the Top 10 in this statistic. It is a stat after my own heart, as I believe offensive and defensive efficiency is the key measurable outside of point differential. Turnovers would factor in there as well, but I am not convinced a team has as much control over that. My power rankings use YPA and YPC differentials. I went ahead and replaced the YPA with offensive and defensive passer rating, to give me this:
(YPC (offense) + Passer Rating (offense) + Avg Pts/Game Scored) – (OPP YPC (defense) + OPP Passer Rating (defense)+ OPP Avg Pts/Game)