
I am an emotional guy. The Seahawks win and life is lollipops and rainbows. The Seahawks lose and the rain is a little wetter and the days a bit shorter. That kind of fluctuation can make it hard to stay objective. It is why I always return to the numbers and put those numbers in context. That helps keep me honest and avoid blindly going along with the dominant narrative or my irrational feelings. Something I have done the last few years is take a snapshot of how the team is doing after each quarter of the season. It helps assess where they are relative to where they were, and often highlights some muted trends that would be hard to otherwise identify. Here we are, three-quarters of the way through this 2017 season. Let’s see how the team is progressing.
New! Identity Check-Up
Over the off-season, I wrote a series on how the Seahawks were trending in some key statistical areas that relate to bedrock aspects of the Pete Carroll philosophy. They speak to the identity of the team Carroll wants to put on the field. I would encourage you to go back and read each part of the series, or simply read the summary here. What I found in researching that series is that the Seahawks were trending in the wrong direction almost across the board across multiple seasons on key metrics that matter. Instead of regurgitating each and every metric, I picked four that I believe represent key aspects of the team identity, and set targets based on where those numbers were during the team’s best seasons. They were:
Rush rate
This is the percentage of plays that were runs. Seattle had regularly been a team that ran the ball more than 50% of the time, but has steadily dropped off and cratered last season with runs on only 38% of their plays. Carroll preaches balance on offense, and wants a physical running game to be part of how they “complete the circle” of toughness. I set a target of 51%, which is still well below the 2012-2014 levels, but represents the type of balance Carroll strives for.
Interceptions per opponent dropback
Carroll tells everyone “It’s all about the ball.” That references both takeaways and giveaways, but my analysis was that takeaways are where things have really dropped off, and specifically, interceptions. The team was at their best in 2012-2014 taking the ball away when their interception rate was 3.2% or higher. I set a target of 3.0%, which would be their best since 2014.
Explosive play differential per game
Another point of emphasis for Carroll is explosive plays. He wants to create them and prevent them. The team has created fewer explosive plays recently and allowed more. That needs to change. I put the target at +2.5 per game, which is similar to their 2013 level, but a bit below.
Special teams DVOA ranking
The Seahawks are at their best when all three units on the team are working together. Carroll values a special teams group that can flip the field. That fell off last year. The target I set was for them to return to a top five unit overall.

The Seahawks rose fractionally on rush rate from 41% to 41.6%. There has been some uptick here over the last two games where the Seahawks run rate has jumped to 45.1%.
Interceptions have trailed off. They had been close to the target of at the midway point when the interception rate was 2.8%, but that they are now down to 2.1%, barely above last season. The good news it the team is averaging 1.6 takeaways per game, which is above the 1.2 takeaways they were averaging last season.
Explosive plays are still an issue. Seattle is allowing 6 per game, which is barely less than the 6.1 they allowed last season. The 2015 team allowed 5.6 explosive plays per game, the 2014 team allowed 4.8 and the 2013 team allowed 5.2. They are also below their pace of past years on offensive explosive plays, especially on the ground. Seattle has managed to win three games this season (@Rams, vs Texans, vs Eagles) when they have lost the explosive play battle. That is unusual for this team, and a sign of some good fortune.
Special teams continue to be below the standard that was set during the Seahawks championship seasons. They have climbed one spot since the halfway point from ranking 17th to being ranked 16th in DVOA. I remain convinced the team needs to revisit both kickers in the offseason.
Situational passer rating
Another area I wanted to watch this season was how Wilson is able to perform during key situations like 3rd down and in the red zone. He was at his best in 2015 when he dominated this type of situational passing. These numbers are not solely on Wilson. The offensive line, play calling, and his receivers play a large role. Still, these are important bellwethers as we monitor his growth as a quarterback.
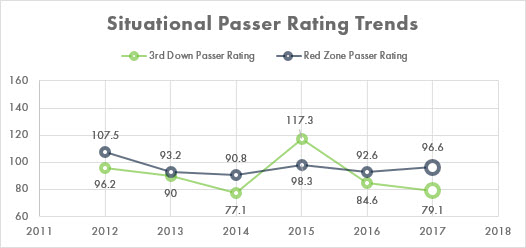
While not sterling, Wilson saw both numbers rise over the past four games. In fact, Wilson had a very nice 99.7 rating on third down and an even better 114.6 rating in the red zone during this four game stretch. He threw 8 red zone touchdowns after having just 11 in his first eight games of the year. That’s a huge jump, and helped his red zone passer rating rise above where it had been last year. He had been at 89.1 at the midway mark of this season.
His third down rating also rose from 71.9 after eight games to 79.1 after 12 games. That is a far cry from his peak play in 2015, but the 99.7 rating he has had the last four games on third down would be his second-highest level if that were sustained over a full season. That is promising.
How have Seahawks trended in Q3?
The chart below compares where the Seahawks were after eight games to where they are now. I like to look both at the absolute numbers and the relative by using NFL rankings.
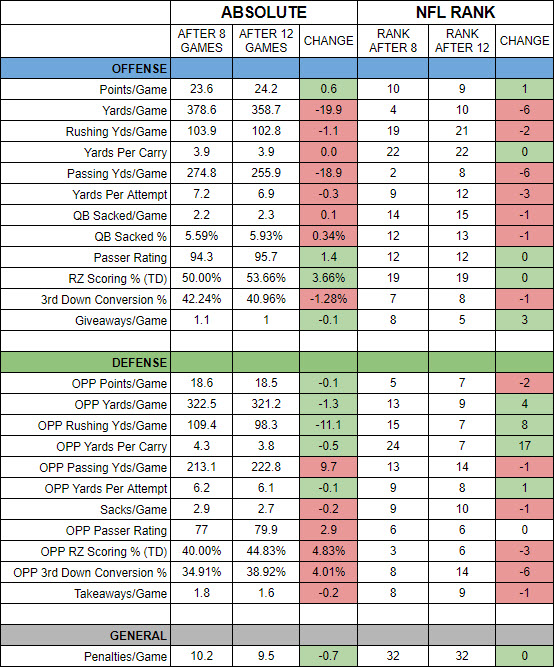
Interesting to see the scoring average go up when all the yardage numbers went down. How did that happen? An improvement in red zone efficiency made Seattle a more potent offense. That coincides with Wilson’s improvement in red zone passer rating. The defense has made great strides in defending the run, but saw a troubling rise in opponent third down and red zone efficiency. Seattle went 3-1 during this four game stretch and outscored opponents 25.3 to 18.3. They now begin the final four games needing to show real improvement if they have hopes of a productive postseason.