
POWER RANKINGS
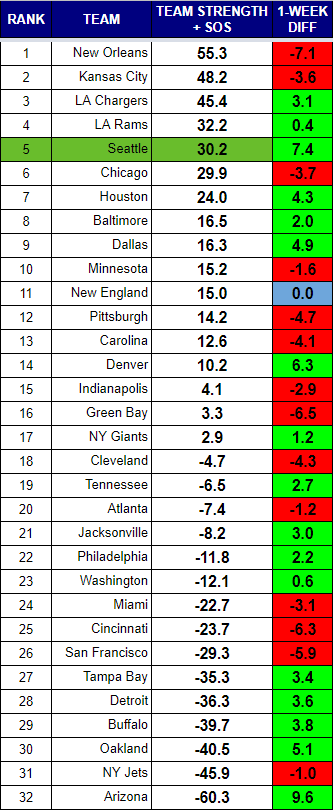
So here’s the thing…I have trouble believing the Seahawks are fifth best team in the NFL. That said, I’d pick Seattle on neutral field to beat the Bears right now. New England? Pittsburgh? Maybe even Houston? I’m not so sure. These rankings, however, are not thinking about matchups. They are simply calculating team efficiency. Seattle has become one of the most efficient teams in the NFL. They are top three in passer rating differential, which has historically correlated strongly with championship squads.
The would have possible risen farther if their strength of schedule had not taken a hit by playing the 49ers. If you take SOS out of the equation completely, the Seahawks and Rams have identical strength scores. Seem crazy? Well they’ve played two very close games, so maybe not.
Chicago, on the other hand has a far strong team strength than either Seattle or the Rams, but they have one of the worst SOS scores in the league, and that drags them down.
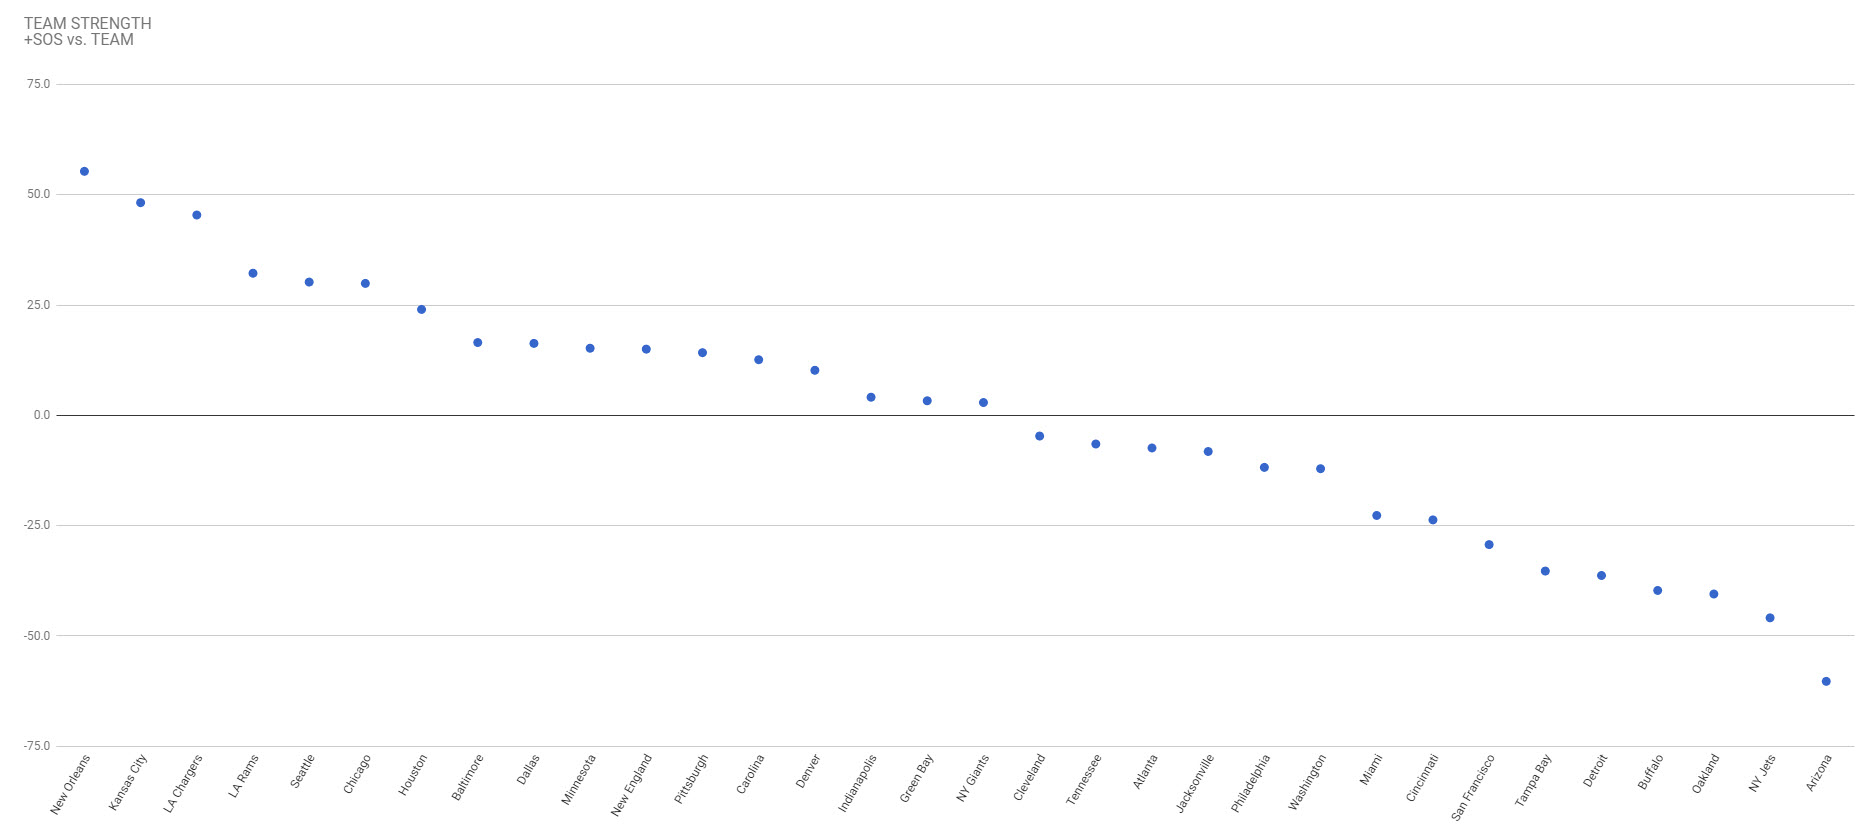
Rankings Visualization
This view shows tiers of strength that develop over the course of the season.
RANKINGS EXPLAINED
Power rankings are always debatable. I don’t buy into the gut feel methods most places use to determine their rankings, so I developed a formula a few years back that attempts to take at least some of the subjectivity out of the discussion. My approach was simple, I measured offensive and defensive efficiency based on the Yards Per Carry (YPC) and Yards Per Attempt (YPA), as well as points scored and points allowed. The formula to calculate “Team Strength” was as follows:
(YPC (offense) + YPA (offense) + Avg Pts/Game Scored) – (YPC (defense) + YPA (defense)+ Avg Pts/Game Allowed)
The formula has proven to be a pretty accurate predictor of success (roughly 70% of the teams ranked in the Top 10 by week 3 make the playoffs), but I am always looking for ways to improve it. I read a great article on ColdHardFootballFacts.com. There was one gem in there about predicting championship teams. The article mentioned passer rating differential as the “mother of all stats.” A full 69 of 72 champions have ranked in the Top 10 in this statistic. It is a stat after my own heart, as I believe offensive and defensive efficiency is the key measurable outside of point differential. Turnovers would factor in there as well, but I am not convinced a team has as much control over that. My power rankings use YPA and YPC differentials. I went ahead and replaced the YPA with offensive and defensive passer rating, to give me this:
(YPC (offense) + Passer Rating (offense) + Avg Pts/Game Scored) – (OPP YPC (defense) + OPP Passer Rating (defense)+ OPP Avg Pts/Game)