
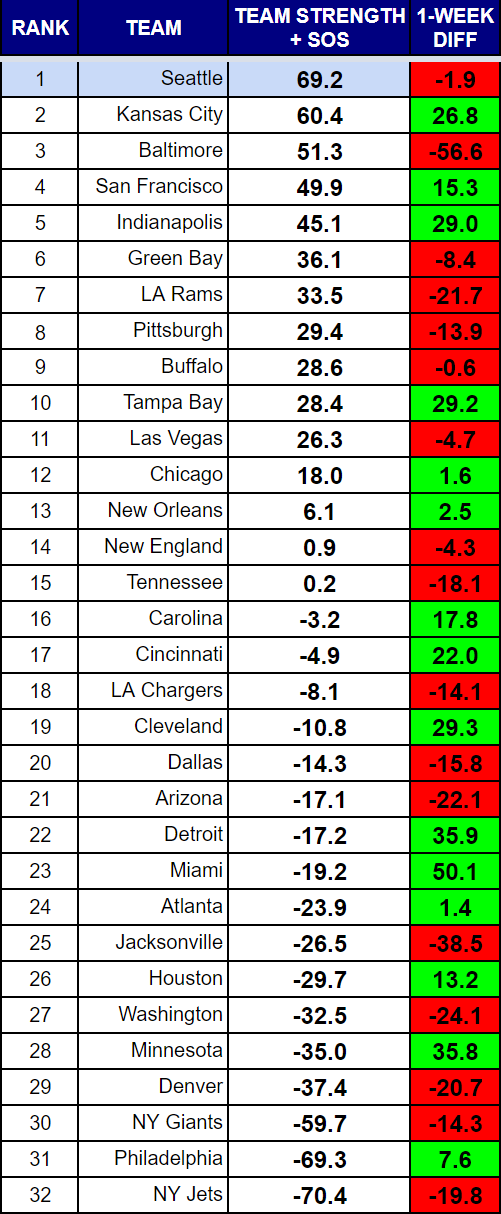
It has been five years since the Seahawks occupied the top spot in these power rankings. They were as high as second early last season, but it has not been since the end of the 2015 season that the Seahawks were number one.
There is some NFC West history repeating itself here as well. If we strip the strength of schedule (SOS) from the ranking formula, the 49ers become the second-ranked team behind Seattle. Only Philly, Pittsburgh, and Indianapolis have had easier schedules than the 49ers so far. Without SOS, the Colts rise to third.
Kansas City has played the second-toughest schedule so far, behind only Houston. That has lifted their status, and reinforces why SOS makes sense to be factored in.
Baltimore took a major tumble after facing the Chiefs after ranking first heading into this week.
Tom Brady took the lead in the Brady vs Belichick race, leapfrogging the Patriots.
Seattle still has 5 of the bottom 6 teams on their schedule, and these rankings are not impressed by Arizona so far.
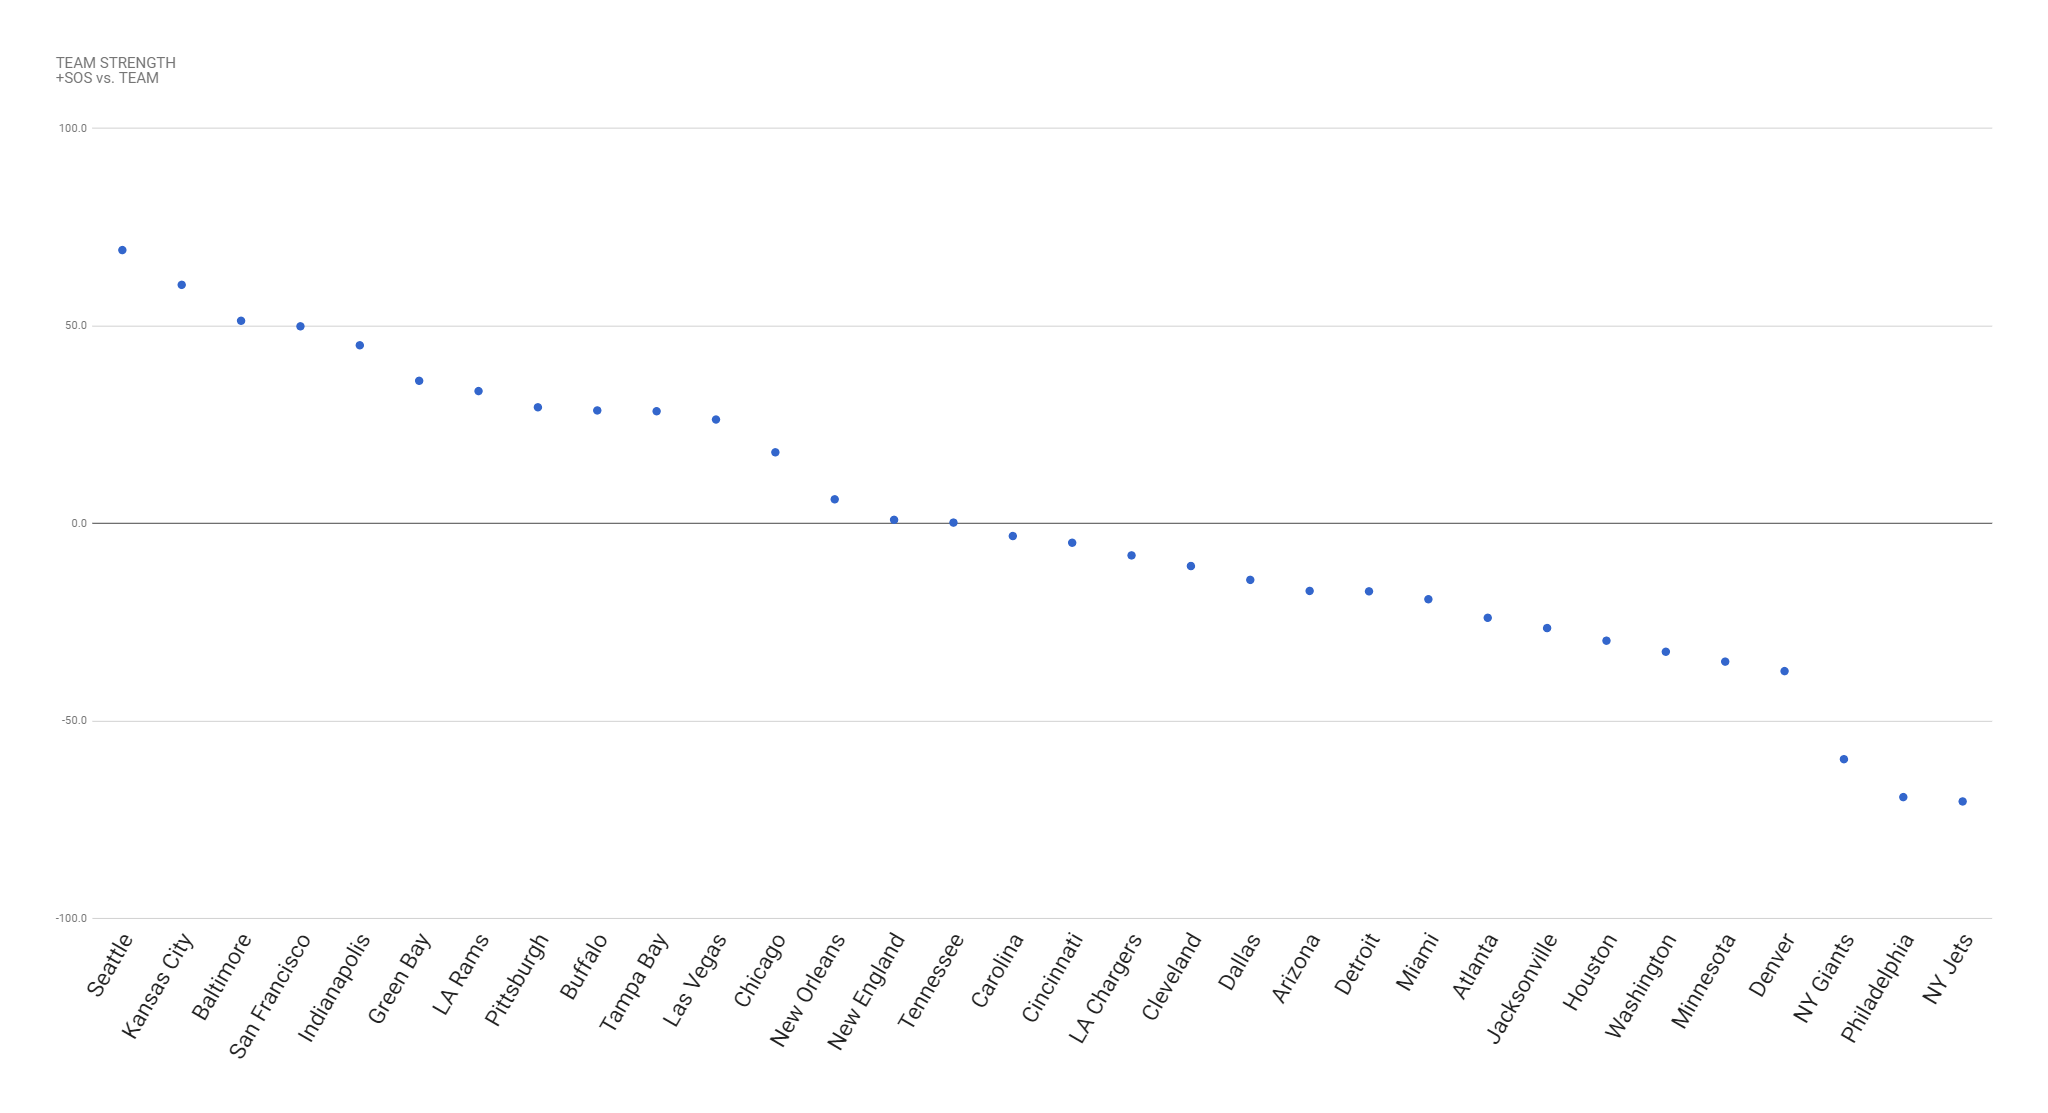
Rankings Visualization
This view shows tiers of strength that develop over the course of the season.
RANKINGS EXPLAINED
Power rankings are always debatable. I don’t buy into the gut feel methods most places use to determine their rankings, so I developed a formula a few years back that attempts to take at least some of the subjectivity out of the discussion. My approach was simple, I measured offensive and defensive efficiency based on the Yards Per Carry (YPC) and Yards Per Attempt (YPA), as well as points scored and points allowed. The formula to calculate “Team Strength” was as follows:
(YPC (offense) + YPA (offense) + Avg Pts/Game Scored) – (YPC (defense) + YPA (defense)+ Avg Pts/Game Allowed)
The formula has proven to be a pretty accurate predictor of success (roughly 70% of the teams ranked in the Top 10 by week 3 make the playoffs), but I am always looking for ways to improve it. I read a great article on ColdHardFootballFacts.com. There was one gem in there about predicting championship teams. The article mentioned passer rating differential as the “mother of all stats.” A full 69 of 72 champions have ranked in the Top 10 in this statistic. It is a stat after my own heart, as I believe offensive and defensive efficiency is the key measurable outside of point differential. Turnovers would factor in there as well, but I am not convinced a team has as much control over that. My power rankings use YPA and YPC differentials. I went ahead and replaced the YPA with offensive and defensive passer rating, to give me this:
(YPC (offense) + Passer Rating (offense) + Avg Pts/Game Scored) – (OPP YPC (defense) + OPP Passer Rating (defense)+ OPP Avg Pts/Game) As of September 23, 2014, I have added a strength of schedule component to the rankings as well. As of November 22, 2016, I have increased the weighting of the run game and point differential. Yards per carry will be multiplied by 10 to make it more evenly weighted with the passer rating. It is still roughly half as important, but will have a greater impact. Point differential will be multiplied by two as it still should be among the most important aspects of measuring teams.