
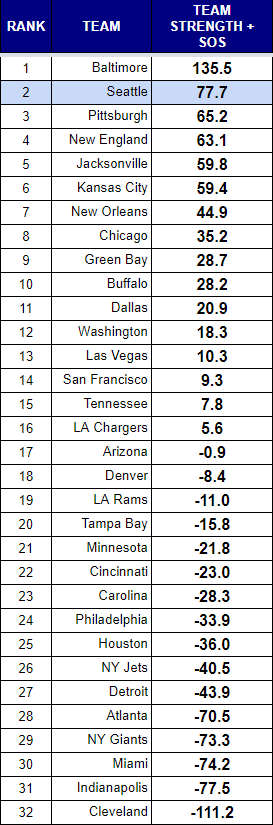
We start the 2020 NFL season with the Seahawks near the top of the power rankings formula. They have not been this high in the rankings for a long time. Of course, this is one week of data, and has historically been the least reliable, but it is nice to see nonetheless.
Baltimore stands out from the pack with a domination offensive and defensive game. Seattle had the offensive side, but not so much the defensive excellence that the Ravens did.
Nobody would mistake Baker Mayfield for Matt Ryan, but even with a strength of schedule modifier, the Ravens earned their spot.
The Patriots have a case to be made for being in the second spot ahead of Seattle. Their raw numbers put them above the Seahawks, but their SOS is 32nd because the Dolphins enter the season with the worst reputation in football.
Jacksonville is one to watch. That was an impressive win against the Colts, and they got efficient QB play from Gardner Minshew.
The Packers boast the best offense after one week, and the Pats get the top ranking for defense.
These rankings tend to be worth paying attention after week three. For now, just enjoy the view from near the top.
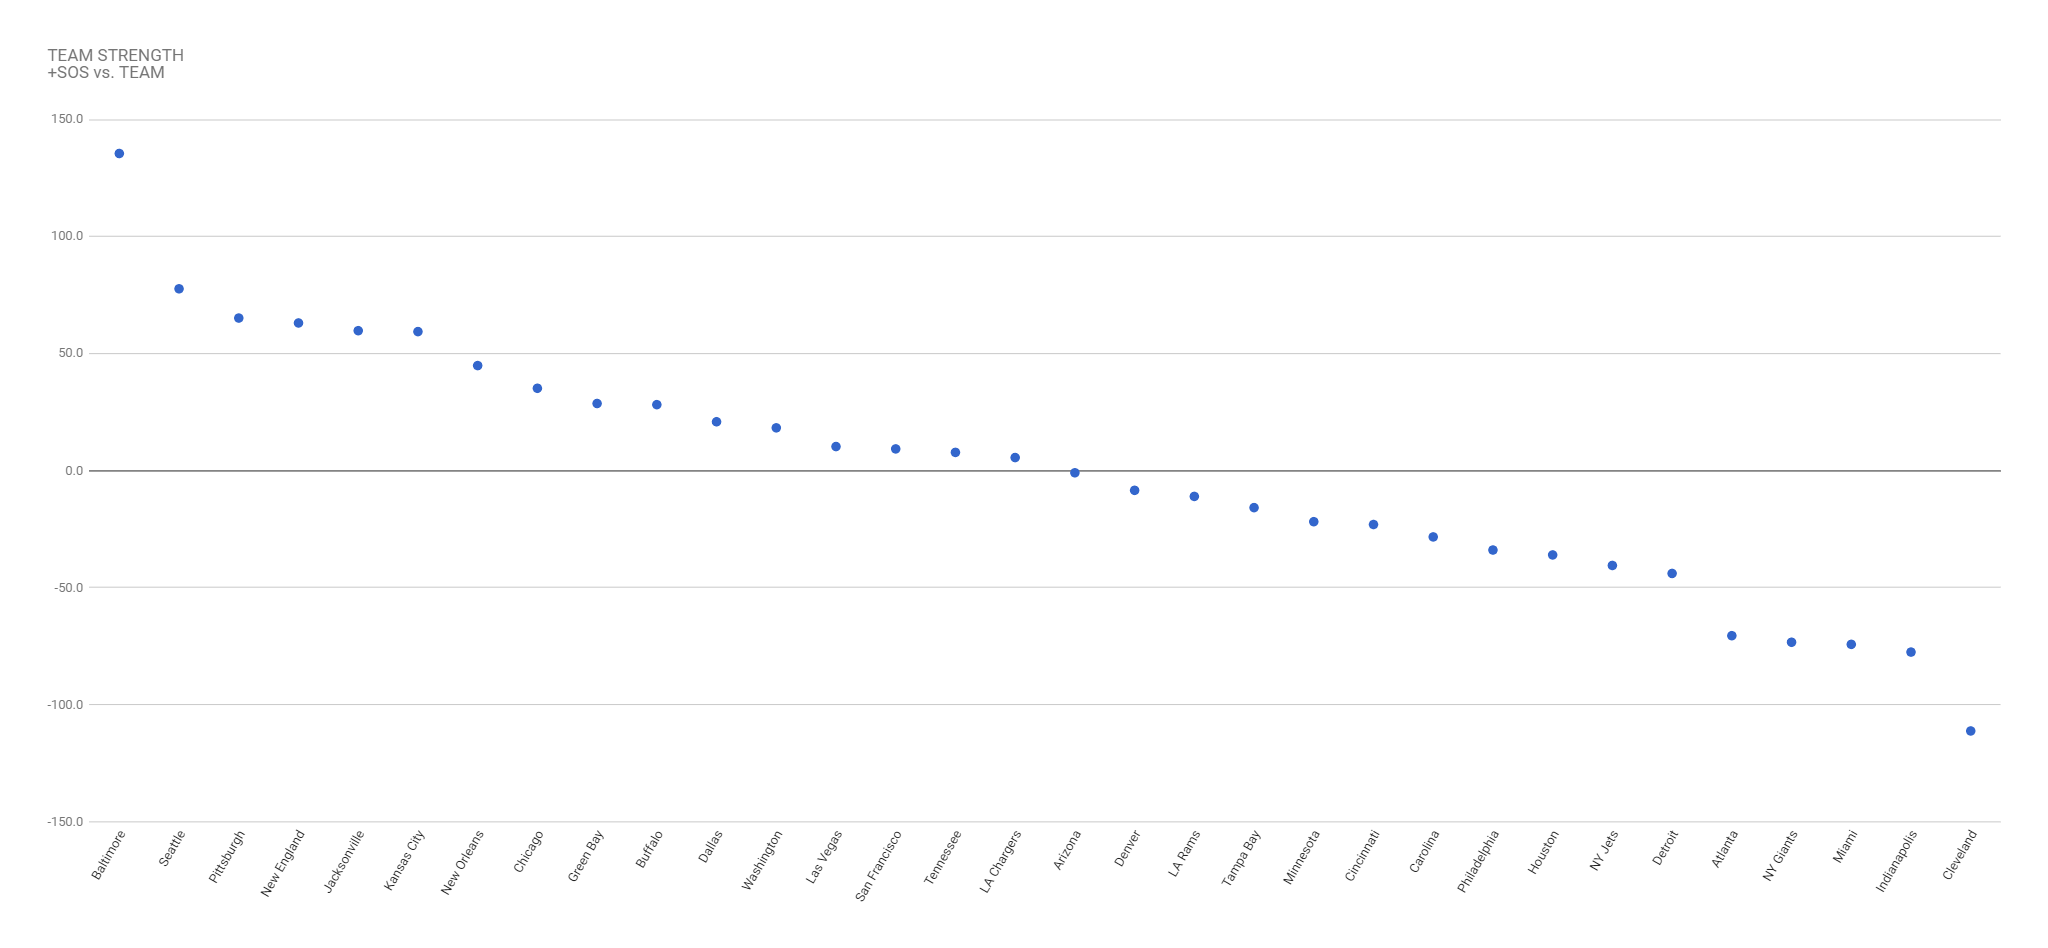
Rankings Visualization
This view shows tiers of strength that develop over the course of the season.
RANKINGS EXPLAINED
Power rankings are always debatable. I don’t buy into the gut feel methods most places use to determine their rankings, so I developed a formula a few years back that attempts to take at least some of the subjectivity out of the discussion. My approach was simple, I measured offensive and defensive efficiency based on the Yards Per Carry (YPC) and Yards Per Attempt (YPA), as well as points scored and points allowed. The formula to calculate “Team Strength” was as follows:
(YPC (offense) + YPA (offense) + Avg Pts/Game Scored) – (YPC (defense) + YPA (defense)+ Avg Pts/Game Allowed)
The formula has proven to be a pretty accurate predictor of success (roughly 70% of the teams ranked in the Top 10 by week 3 make the playoffs), but I am always looking for ways to improve it. I read a great article on ColdHardFootballFacts.com. There was one gem in there about predicting championship teams. The article mentioned passer rating differential as the “mother of all stats.” A full 69 of 72 champions have ranked in the Top 10 in this statistic. It is a stat after my own heart, as I believe offensive and defensive efficiency is the key measurable outside of point differential. Turnovers would factor in there as well, but I am not convinced a team has as much control over that. My power rankings use YPA and YPC differentials. I went ahead and replaced the YPA with offensive and defensive passer rating, to give me this:
(YPC (offense) + Passer Rating (offense) + Avg Pts/Game Scored) – (OPP YPC (defense) + OPP Passer Rating (defense)+ OPP Avg Pts/Game) As of September 23, 2014, I have added a strength of schedule component to the rankings as well. As of November 22, 2016, I have increased the weighting of the run game and point differential. Yards per carry will be multiplied by 10 to make it more evenly weighted with the passer rating. It is still roughly half as important, but will have a greater impact. Point differential will be multiplied by two as it still should be among the most important aspects of measuring teams.