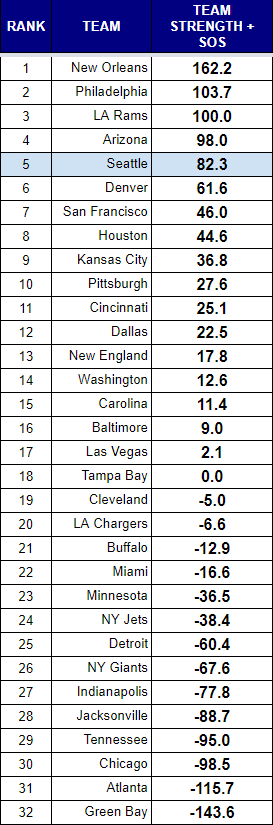
We start the 2021 season with a familiar name at the top of the rankings, but with a new quarterback. New Orleans has been a great team for years, but their domination of the Green Bay Packers this week has to be one of their most impressive victories in memory. They had their way offensively and defensively against a team with the reigning MVP that went to the NFC Championship last year.
Philadelphia is a surprise in the second spot. The Jalen Hurts era has to have Eagles fans hopeful for the first time in a while. There is at least some reason to wait a few weeks before getting too excited as Atlanta is far from a quality opponent. Just last year, Gardner Minshew and the Jags we hanging around the top ten of these rankings after a week one win against the Colts.
Four of the next five spots are occupied by the NFC West. The Rams barely squeak by the Cardinals for the third spot, with Seattle a little further back at five. The 49ers check in at seven. It is notable that the NFC occupies the top five spots and six of the top seven.
Seattle boasts the second-highest offensive efficiency score in the formula, behind only the 49ers. They also have a top ten defensive efficiency score, which is a massive change from where they were a year ago.
These rankings tend to be worth paying attention after week three. For now, just enjoy the view from near the top.
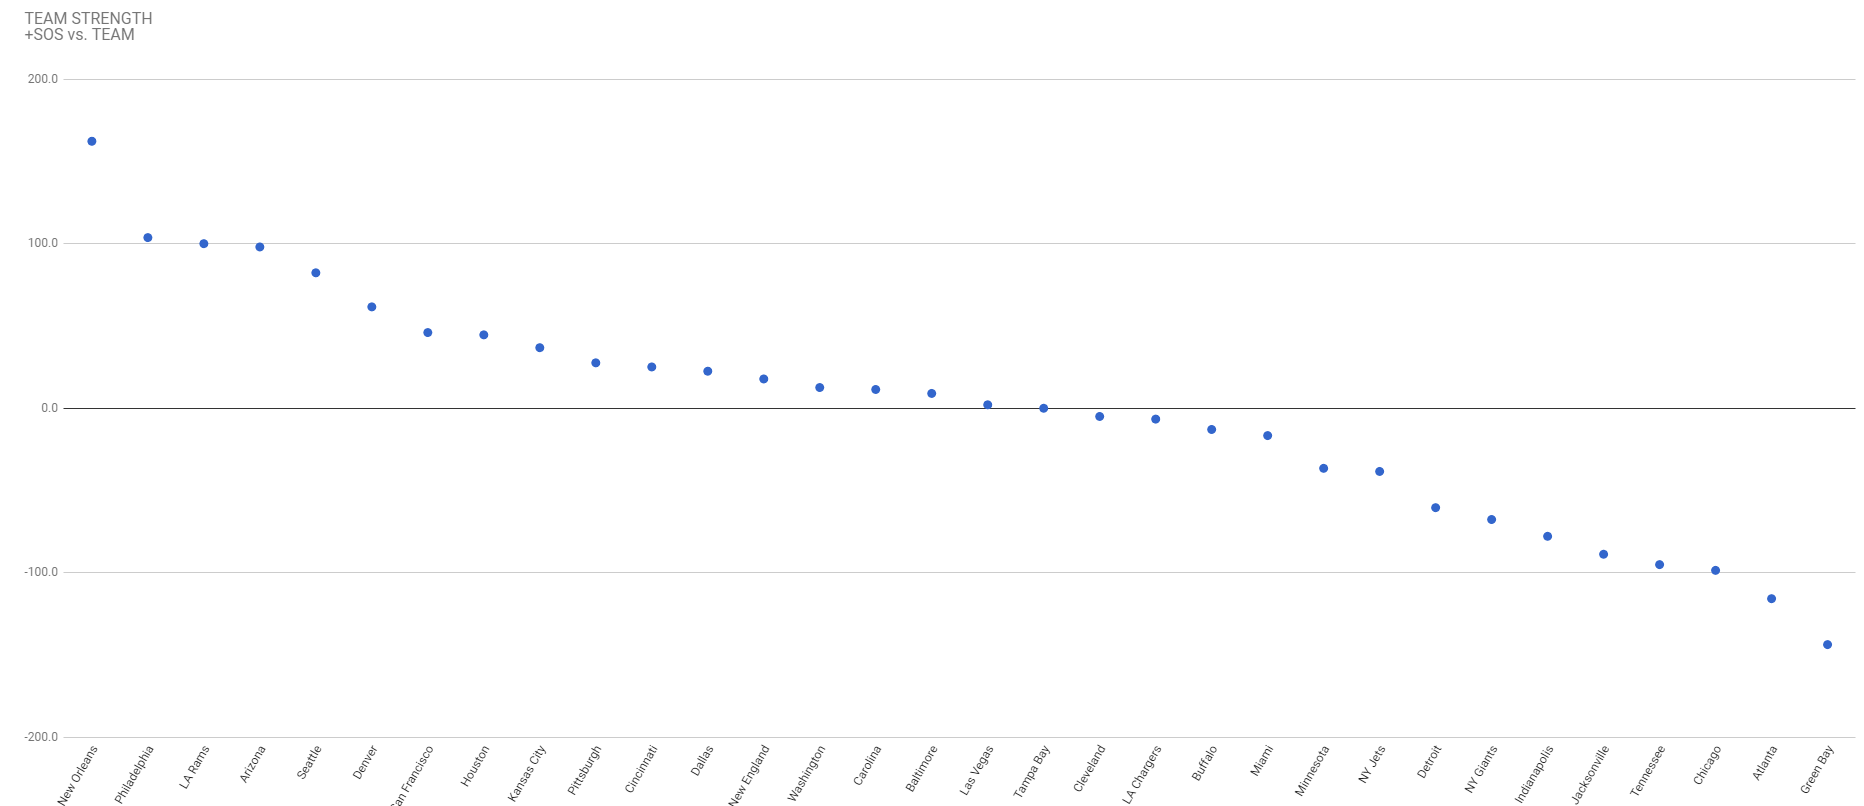
Rankings Visualization
This view shows tiers of strength that develop over the course of the season.
RANKINGS EXPLAINED
Power rankings are always debatable. I don’t buy into the gut feel methods most places use to determine their rankings, so I developed a formula a few years back that attempts to take at least some of the subjectivity out of the discussion. My approach was simple, I measured offensive and defensive efficiency based on the Yards Per Carry (YPC) and Yards Per Attempt (YPA), as well as points scored and points allowed. The formula to calculate “Team Strength” was as follows:
(YPC (offense) + YPA (offense) + Avg Pts/Game Scored) – (YPC (defense) + YPA (defense)+ Avg Pts/Game Allowed)
The formula has proven to be a pretty accurate predictor of success (roughly 70% of the teams ranked in the Top 10 by week 3 make the playoffs), but I am always looking for ways to improve it. I read a great article on ColdHardFootballFacts.com. There was one gem in there about predicting championship teams. The article mentioned passer rating differential as the “mother of all stats.” A full 69 of 72 champions have ranked in the Top 10 in this statistic. It is a stat after my own heart, as I believe offensive and defensive efficiency is the key measurable outside of point differential. Turnovers would factor in there as well, but I am not convinced a team has as much control over that. My power rankings use YPA and YPC differentials. I went ahead and replaced the YPA with offensive and defensive passer rating, to give me this:
(YPC (offense) + Passer Rating (offense) + Avg Pts/Game Scored) – (OPP YPC (defense) + OPP Passer Rating (defense)+ OPP Avg Pts/Game) As of September 23, 2014, I have added a strength of schedule component to the rankings as well. As of November 22, 2016, I have increased the weighting of the run game and point differential. Yards per carry will be multiplied by 10 to make it more evenly weighted with the passer rating. It is still roughly half as important, but will have a greater impact. Point differential will be multiplied by two as it still should be among the most important aspects of measuring teams.