It’s been three weeks since power rankings were last posted here. Much has changed. Remarkably, as poorly as the Seahawks have played through much of the past month, they remain near the top of the rankings, and nearly equal to the Rams.
Seattle is helped by a league-leading 129.9 passer rating registered by Russell Wilson. It is far and away the best in the NFL to this point. Seattle also has a top ten yards per rush average at 4.7 yards per carry. Their offense ranks fourth overall, behind Kansas City, Dallas, and Arizona. The Rams offense actually ranks lower, in part, due to a struggling run game that is averaging just 3.8 yards per rush.
The Seahawks defense is bad. Only the Chiefs have a worse defense among the teams in the top ten. The Rams defense has been better than the Seahawks, but is still the third worst defense in the top ten.
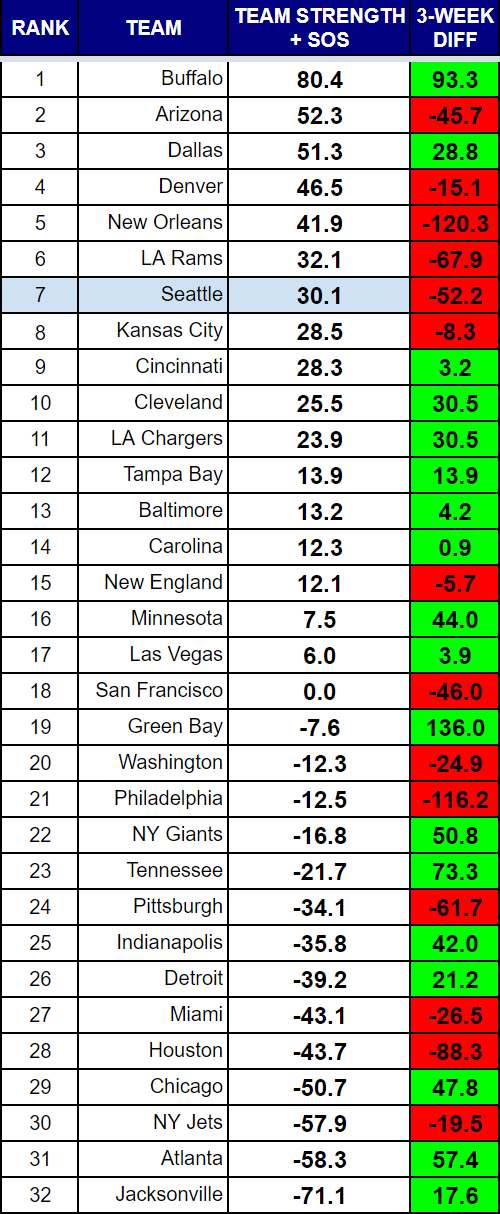
Buffalo is far and away the best team right now, but has built some of that strength on a very weak schedule.
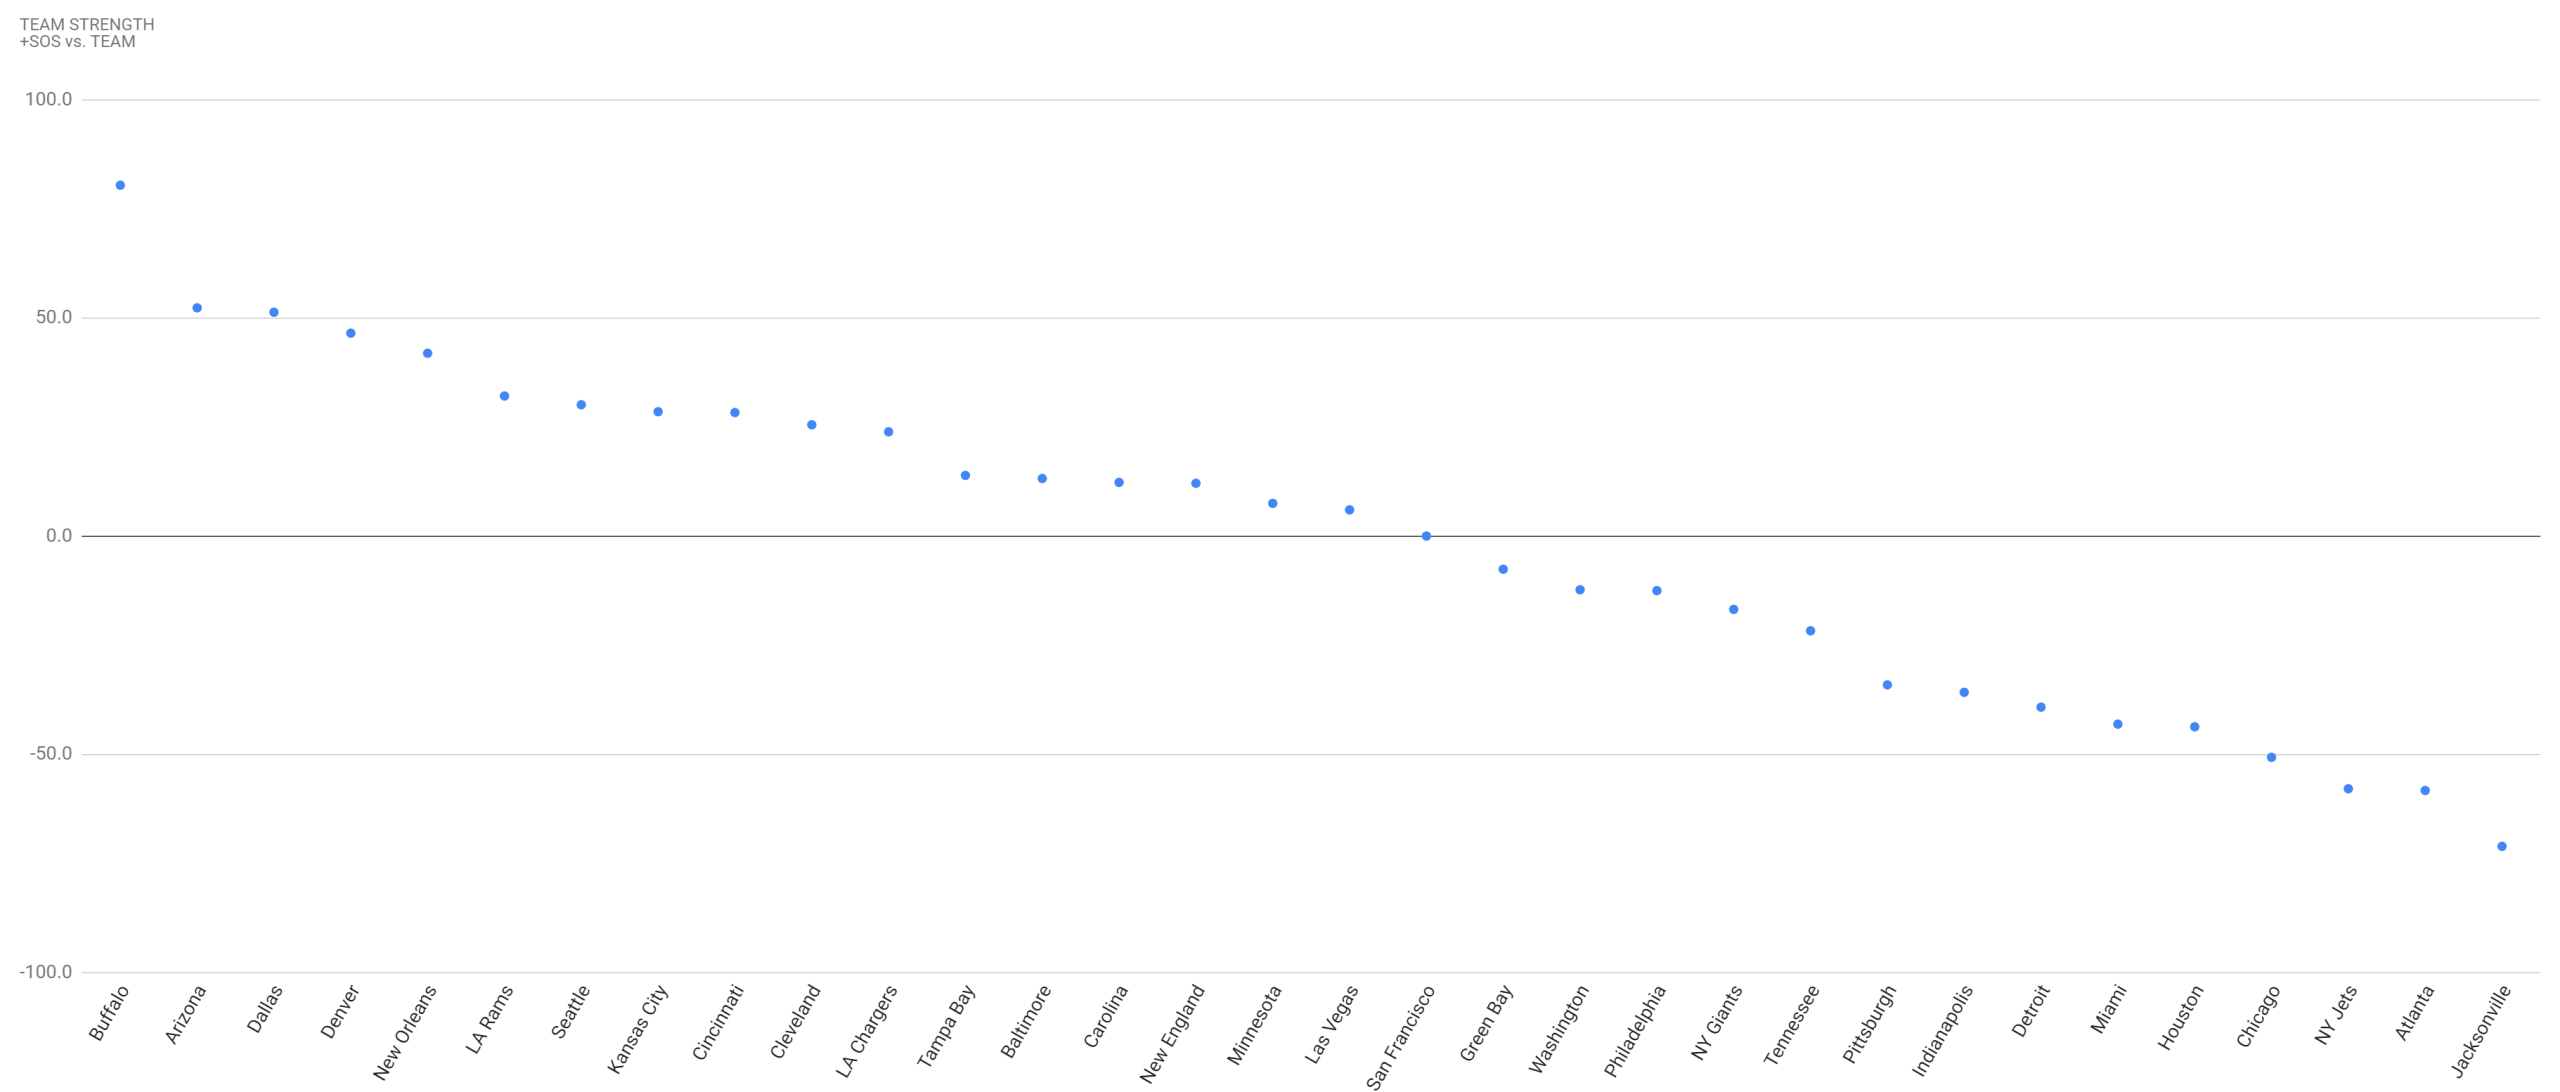
Rankings Visualization
This view shows tiers of strength that develop over the course of the season.
RANKINGS EXPLAINED
Power rankings are always debatable. I don’t buy into the gut feel methods most places use to determine their rankings, so I developed a formula a few years back that attempts to take at least some of the subjectivity out of the discussion. My approach was simple, I measured offensive and defensive efficiency based on the Yards Per Carry (YPC) and Yards Per Attempt (YPA), as well as points scored and points allowed. The formula to calculate “Team Strength” was as follows:
(YPC (offense) + YPA (offense) + Avg Pts/Game Scored) – (YPC (defense) + YPA (defense)+ Avg Pts/Game Allowed)
The formula has proven to be a pretty accurate predictor of success (roughly 70% of the teams ranked in the Top 10 by week 3 make the playoffs), but I am always looking for ways to improve it. I read a great article on ColdHardFootballFacts.com. There was one gem in there about predicting championship teams. The article mentioned passer rating differential as the “mother of all stats.” A full 69 of 72 champions have ranked in the Top 10 in this statistic. It is a stat after my own heart, as I believe offensive and defensive efficiency is the key measurable outside of point differential. Turnovers would factor in there as well, but I am not convinced a team has as much control over that. My power rankings use YPA and YPC differentials. I went ahead and replaced the YPA with offensive and defensive passer rating, to give me this:
(YPC (offense) + Passer Rating (offense) + Avg Pts/Game Scored) – (OPP YPC (defense) + OPP Passer Rating (defense)+ OPP Avg Pts/Game) As of September 23, 2014, I have added a strength of schedule component to the rankings as well. As of November 22, 2016, I have increased the weighting of the run game and point differential. Yards per carry will be multiplied by 10 to make it more evenly weighted with the passer rating. It is still roughly half as important, but will have a greater impact. Point differential will be multiplied by two as it still should be among the most important aspects of measuring teams.