They won’t appear in a highlight on SportsCenter or have their jerseys among the top sellers in the NFL, but offensive line play is one of the most crucial aspects of success for any football team. Years of reducing padded practices, changes to spread offenses in lower levels, and many younger athletes choosing to sack quarterbacks instead of protecting them, has diminished the quality of offensive linemen entering the league and the ability to develop them once they arrive. Teams have been trying to adjust to the new reality for well over a decade. Some have done better than others. This past offseason provided a perfect chance to compare how different teams are trying to improve their line play, and how those approaches are working out.
Methodology
We will look at the offensive line play of all 32 teams, but will focus on a few teams that took markedly different approaches to assembling their 2025 lines. Some teams prioritized the draft, some used free agency, some used trades, some went old and some went young.
The focus teams:
- Chicago Bears
- Minnesota Vikings
- Seattle Seahawks
It can be difficult to quantify offensive line play, especially run blocking, but we will lean on the best metrics we can find across different sites. The ESPN Pass Block Win Rate (PBWR) and Run Block Win Rate (RBWR) is at least a consistently applied measure of both pass blocking and run blocking for the offensive line. Pro Football Focus does not have an easy way to isolates aggregate line grades for run blocking, but they do have an OL-only pass block efficiency metric. We will supplement the run blocking data with NFL Next Gen Stats yards before contact and Adjusted Line Yards from FTNFantasy.
The Offseason Approach
Chicago Bears

The Bears gave up an NFL-high 68 sacks in 2024 while also rushing for the 7th-fewest yards. It was a disaster on just about every level. Sweeping changes were made, starting with a new head coach, Ben Johnson. Johnson made a name for himself in Detroit, where a heavy emphasis on the run game and play-action was amplified by excellent offensive line play.
Chicago did not rely solely on personnel changes to improve their line play. They increased their run play rate from 40.5% (25th) to 47% (7th), and their play-action rate from 17% (30th) to 31.1% (3rd). Running more often, regardless of efficiency, means fewer drop backs and pass block snaps. It also impacts the defenses ability to focus on rushing the passer as they have to honor the run. Play-action has a similar effect on creating doubt in the mind of pass rushers, which is more effective when combined with a greater commitment to running the ball.
Johnson also dramatically increased the amount of snaps under center versus shotgun. The Bears are under center almost half the time in 2025 (49.8%), an increase of over 20% from 2024 (28.9%). Under center play-action is more effective than shotgun play-action, in part, due to the time between the snap of the ball and when the play fake occurs, which allows receivers to get further into their routes and causes second-level defenders to hesitate for longer before committing to defending the run or the pass.
For personnel, the Bears did a little bit of everything. They went big on the trade market, adding All-Pro guard Joe Thuney from the Kansas City Chiefs and former Pro Bowl guard Jonah Jackson from the Rams. They then spent top of the market free agent money on center Drew Dalman from the Atlanta Falcons. All veterans. All starters.
They also spent a high pick (2nd round) on offensive tackle Ozzy Trapilo from Boston College. Trapilo was not drafted to start, but has been pressed into action due to injury.
The Bears starting offensive line of Braxton Jones (26), Thuney (32), Dalman (26), Jackson (28), and Darnell Wright (24), ranked 19th in average age (27.2) to start the season.
Minnesota Vikings
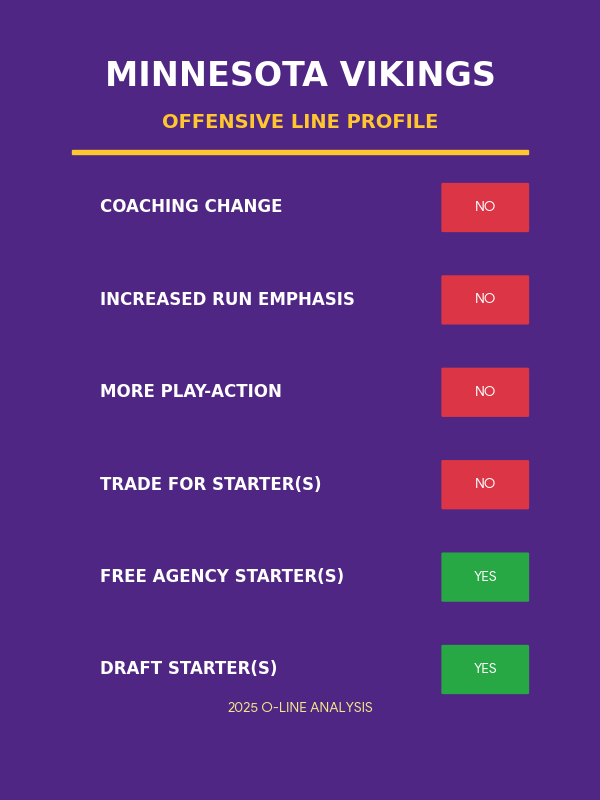
Unlike the Bears, the Vikings were coming off a highly successful 2024 campaign that saw that saw them win 14 games and rank 9th in points scored. They did struggle with offensive line play, especially after injuries took out left tackle Christian Darrisaw. Their season was marred by an ugly two-game finish that included allowing 9 sacks in their playoff loss to the Los Angeles Rams.
Much of the blame for that performance went to quarterback Sam Darnold, but the Vikings knew the interior line play was a significant issue. They were largely satisfied with the coaching and scheme. Their focus was on improving personnel.
They spent significant free agent dollars on guard Will Fries and center Ryan Kelly. They also spent the 24th pick in the 1st round on guard Donovan Jackson. The hope was that Darrisaw would return to health.
Darnold was not re-signed and the team turned to their top draft pick in 2024, J.J. McCarthy to take over at quarterback.
The Vikings starting offensive line of Christian Darrisaw (26), Donovan Jackson (22), Ryan Kelly (32), Will Fries (27), Brian O’Neill (29), ranked 19th in average age (27.2) to start the season.
Seattle Seahawks
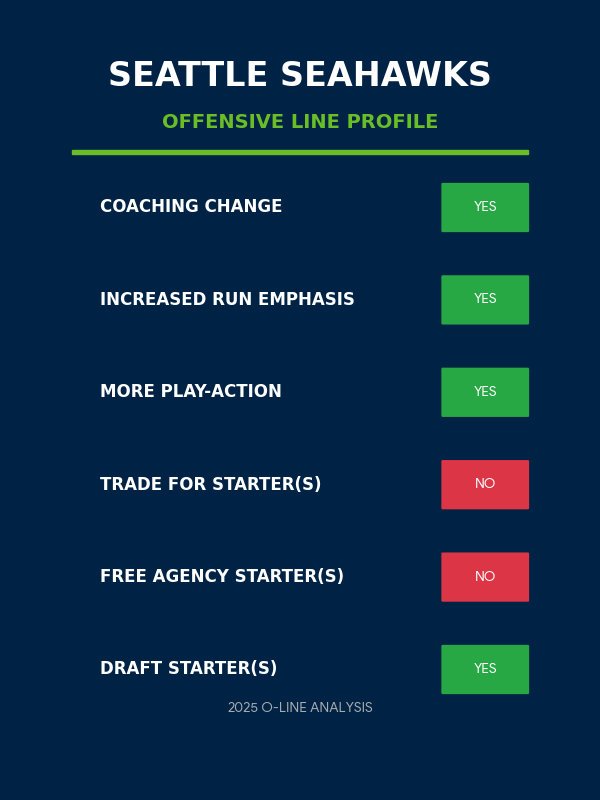
The Seahawks offensive line has been the butt of many jokes for over a decade. From 2015-2023, the Seahawks allowed 408 sacks, 3rd-most in the NFL, and a 7.9% sack rate, 2nd-highest in the NFL. Their coaching staff and front office has come under considerable fire for their lack of investment in the position, especially interior offensive line.
Mike Macdonald took over as coach in 2024, but the problems continued. Seattle ranked 24th in sack rate, adding another 50 sacks to their seemingly never-ending misery. Their starting center, Connor Williams, even retired over their bye week.
Macdonald fired their offensive coordinator, Ryan Grubb, after one season, citing philosophical differences that appeared to center around the lack of utilization of the run game and play-action. Klint Kubiak was hired, and he brought veteran offensive line coach John Benton, along with Rick Dennison and Justin Outten.
Kubiak was clear this would be an outsize zone running team with counters off of that that included play-action and rollouts that moved the pocket.
Seattle went from 28th in run rate (37.2%) in 2024 to 1st in 2025 (51.1%). Their play-action rate rose from 29th (17.3%) last season to 10th (26.5%) through Week 12 in 2025. Like the Bears, they also put heavy emphasis on under center snaps. Their under center rate more than doubled (23.2% to 55.6%) from the previous season.
They took the Vikings outcast at quarterback, Darnold, and made him their starter. Kubiak and new QB coach, Andrew Janocko, helped reduce Darnold’s time to throw from 3.08 seconds in 2024 (41st among QBs) to 2.69 seconds in 2025 (11th).
Their personnel approach prioritized trying to sign Fries as a free agent guard. Their refusal to waive a physical for a player coming off a serious leg injury caused Fries to spurn their offer in favor of the Vikings. In turn, that increased the priority of interior offensive line in the draft, where they spent their 1st round pick on guard Grey Zabel. They also drafted two more linemen, Bryce Cabeldue and Mason Richman, in later rounds.
They let 2023 draft pick Olu Oluwatimi and 2024 undrafted free agent Jalen Sundell compete for the starting center spot. Right guard was a competition between 2024 3rd round pick, Christian Haynes, and 2023 4th round pick, Anthony Bradford. Sundell and Bradford won the starting spots. The team largely counted on a return to health for 2022 3rd round pick, Abe Lucas, at right tackle.
That left the Seahawks starting offensive line of Charles Cross (24), Zabel (23), Sundell (25), Bradford (24), Lucas (26), as the 3rd-youngest average age (24.4) to start the season.
Early Returns
Pass blocking
Pro Football Focus measures the amount of pressures an offensive line surrenders and comes up with a pass block efficiency metric based on the number of drop back snaps for each team. Here is a look at how that efficiency measure changed from 2024 to 2025 for every team in the NFL.
Note: The charts/tables are best viewed in landscape orientation when on phone
Year-Over-Year Change in Pass Block Efficiency
2024–2025 NFL Season | Source: Pro Football Focus
The Seahawks and Bears have seen two of the largest four increases in pass block efficiency from their offensive lines. The Vikings saw some improvement as well, but were relatively close to their previous year.
Seattle ranked dead last in this metric in 2024, and currently ranks 12th (+20 spots). That is largest jump of the three teams. Chicago went from 21st to 2nd (+19), and the Vikings went from 30th to 28th (+2).
ESPN has a different way to measure pass blocking that focuses on whether linemen are beat quickly (under 2.5 seconds). It often yields a different view from the PFF data. This looks at the change in rank among all 32 teams from 2024 to 2025 in that metric.
Year-Over-Year Change in Pass Block Win Rate Rankings
2024–2025 NFL Season | Source: ESPN
The Bears made the largest jump by this metric, improving from 15th to 1st. Thuney leads all interior offensive linemen in this ranking across the NFL. Dalman ranks 7th and Jackson ranked 8th, giving the Bears three Top 10 interior players in pass block win rate. Seattle made a sizable improvement here as well, going from 21st to 10th. Charles Cross ranks 9th among offensive tackles. Minnesota is dead last, dropping 21 spots from 2nd to 23rd. Right tackle Brian O’Neill ranks 18th. You have to wonder if quarterback play is contributing to the difference for the Vikings.
Seattle has allowed the fewest sacks in the NFL (11), and the lowest total through 11 games in franchise history. The Bears have made huge strides in sacks allowed as well, with the largest gain in QB sack rate.
NFL Sack Rate Changes: 2024 vs 2025
Year-Over-Year Performance Analysis
| Rank | Team | 2024 Rate | 2025 Rate | Change | 2024 Sacks | 2025 Sacks |
|---|---|---|---|---|---|---|
| 1 | Chicago Bears | 9.94% | 4.19% | -5.75% | 68 | 19 |
| 2 | Seattle Seahawks | 8.04% | 3.46% | -4.58% | 54 | 11 |
| 3 | Pittsburgh Steelers | 8.35% | 5.72% | -2.63% | 49 | 21 |
| 4 | Houston Texans | 8.14% | 5.62% | -2.52% | 54 | 25 |
| 5 | Dallas Cowboys | 5.53% | 3.52% | -2.01% | 38 | 17 |
| 6 | Philadelphia Eagles | 8.41% | 6.77% | -1.64% | 45 | 27 |
| 7 | San Francisco 49ers | 5.83% | 4.20% | -1.63% | 36 | 19 |
| 8 | Cleveland Browns | 8.65% | 7.03% | -1.62% | 66 | 30 |
| 9 | Cincinnati Bengals | 6.65% | 5.10% | -1.55% | 48 | 25 |
| 10 | Los Angeles Rams | 5.22% | 3.83% | -1.39% | 31 | 15 |
| 11 | Atlanta Falcons | 5.35% | 4.44% | -0.91% | 32 | 17 |
| 12 | Kansas City Chiefs | 6.03% | 5.28% | -0.75% | 41 | 27 |
| 13 | Denver Broncos | 3.72% | 3.10% | -0.62% | 24 | 13 |
| 14 | Washington Commanders | 7.63% | 7.16% | -0.47% | 50 | 27 |
| 15 | Tampa Bay Buccaneers | 6.13% | 5.67% | -0.46% | 40 | 24 |
| 16 | Indianapolis Colts | 5.63% | 5.28% | -0.35% | 32 | 21 |
| 17 | Miami Dolphins | 6.53% | 6.34% | -0.19% | 43 | 23 |
| 18 | Green Bay Packers | 4.22% | 4.24% | +0.02% | 22 | 17 |
| 19 | New England Patriots | 8.18% | 8.39% | +0.21% | 52 | 37 |
| 20 | New York Giants | 7.17% | 7.41% | +0.24% | 48 | 34 |
| 21 | New Orleans Saints | 6.02% | 6.39% | +0.37% | 37 | 28 |
| 22 | Los Angeles Chargers | 7.50% | 8.13% | +0.63% | 44 | 37 |
| 23 | Detroit Lions | 5.51% | 6.30% | +0.79% | 33 | 26 |
| 24 | Carolina Panthers | 5.76% | 6.56% | +0.80% | 36 | 28 |
| 25 | Jacksonville Jaguars | 5.29% | 6.86% | +1.57% | 32 | 29 |
| 26 | Tennessee Titans | 8.46% | 10.30% | +1.84% | 52 | 45 |
| 27 | Minnesota Vikings | 7.83% | 9.87% | +2.04% | 49 | 39 |
| 28 | Las Vegas Raiders | 7.09% | 9.93% | +2.84% | 50 | 41 |
| 29 | Arizona Cardinals | 4.89% | 8.10% | +3.21% | 30 | 40 |
| 30 | New York Jets | 6.02% | 10.10% | +4.08% | 40 | 39 |
| 31 | Baltimore Ravens | 4.39% | 9.02% | +4.63% | 24 | 34 |
| 32 | Buffalo Bills | 2.42% | 7.09% | +4.67% | 14 | 28 |
Note:
Improved (lower sack rate) Worsened (higher sack rate)
Again, it has not gone as well for the Vikings. It is worth point out they have experienced a number of injuries along the offensive line. However, their offseason strategy involved counting on their left tackle to recover quickly from a serious knee injury, an older center who had injury issues the last few years, and a free agent guard who was coming off a serious leg injury that caused Seattle to walk away when he refused a physical.
Run blocking
The metrics to track run blocking are more challenging, especially when trying to isolate only to the offensive line. Some teams, like Seattle, have moved to greater use of a fullback and multiple tight ends. Their performance has a significant impact on the health of the running game.
There are a few metrics worth checking in on. Yards before contact per rush attempt provides a glimpse into how quickly defenders are getting past blockers to contact the runner. Obviously, the runner plays a large role in when they contacted as well, but it is still worth a look.
Yards Before Contact Per Rush Attempt: 2024 vs 2025
Source: SumerSports
| Team | 2024 YBC/Att | 2024 Rank | 2025 YBC/Att | 2025 Rank | Improvement | Rank Change |
|---|---|---|---|---|---|---|
| Chicago Bears | 1.68 | 27 | 2.46 | 1 | +0.78 | +26 |
| Los Angeles Chargers | 1.82 | 19 | 2.35 | 4 | +0.53 | +15 |
| Buffalo Bills | 1.81 | 21 | 2.29 | 6 | +0.48 | +15 |
| Jacksonville Jaguars | 1.56 | 30 | 1.97 | 13 | +0.41 | +17 |
| Denver Broncos | 1.92 | 12 | 2.31 | 5 | +0.39 | +7 |
| Minnesota Vikings | 1.84 | 18 | 2.22 | 7 | +0.38 | +11 |
| Houston Texans | 1.76 | 24 | 2.10 | 10 | +0.34 | +14 |
| New York Jets | 1.93 | 11 | 2.21 | 9 | +0.28 | +2 |
| Dallas Cowboys | 1.61 | 29 | 1.85 | 16 | +0.24 | +13 |
| Detroit Lions | 2.16 | 7 | 2.37 | 3 | +0.21 | +4 |
| New England Patriots | 1.52 | 31 | 1.72 | 21 | +0.20 | +10 |
| Carolina Panthers | 1.91 | 13 | 2.02 | 12 | +0.11 | +1 |
| Kansas City Chiefs | 2.13 | 8 | 2.22 | 7 | +0.09 | +1 |
| Los Angeles Rams | 1.85 | 15 | 1.89 | 15 | +0.04 | 0 |
| Miami Dolphins | 1.63 | 28 | 1.65 | 23 | +0.02 | +5 |
| Cincinnati Bengals | 1.85 | 15 | 1.85 | 16 | 0.00 | -1 |
| New York Giants | 1.91 | 13 | 1.90 | 14 | -0.01 | -1 |
| Seattle Seahawks | 1.74 | 25 | 1.60 | 26 | -0.14 | -1 |
| Atlanta Falcons | 1.80 | 22 | 1.62 | 24 | -0.18 | -2 |
| Pittsburgh Steelers | 1.74 | 25 | 1.51 | 29 | -0.23 | -4 |
| Tennessee Titans | 1.82 | 19 | 1.52 | 28 | -0.30 | -9 |
| Washington Commanders | 2.36 | 3 | 2.06 | 11 | -0.30 | -8 |
| Green Bay Packers | 1.94 | 10 | 1.62 | 24 | -0.32 | -14 |
| Baltimore Ravens | 2.75 | 1 | 2.38 | 2 | -0.37 | -1 |
| Tampa Bay Buccaneers | 2.06 | 9 | 1.68 | 22 | -0.38 | -13 |
| Las Vegas Raiders | 1.43 | 32 | 1.02 | 32 | -0.41 | 0 |
| Cleveland Browns | 1.79 | 23 | 1.32 | 30 | -0.47 | -7 |
| Arizona Cardinals | 2.25 | 5 | 1.75 | 20 | -0.50 | -15 |
| Indianapolis Colts | 2.33 | 4 | 1.82 | 18 | -0.51 | -14 |
| San Francisco 49ers | 2.17 | 6 | 1.54 | 27 | -0.63 | -21 |
| New Orleans Saints | 1.85 | 15 | 1.22 | 31 | -0.63 | -16 |
| Philadelphia Eagles | 2.57 | 2 | 1.80 | 19 | -0.77 | -17 |
Finally, some good news for the Vikings. Minnesota has made the 6th-highest rate of all teams in this metric. The Bears top the list. Seattle has seen a step back here. NFL Next Gen Stats tracks this metric and shows Seattle improving slightly, but they are well behind the Vikings and Bears in terms of improving in this metric.
Adjusted Line Yards is a metric created by Aaron Schatz of FTNFantasy.com, in an attempt to isolate the performance of the offensive line when it comes to creating rushing yards. Here is how the teams rank there.
NFL Adjusted Line Yards: 2024 vs 2025
Source: FTNFantasy.com
| Team | 2024 ALY | 2024 Rank | 2025 ALY | 2025 Rank | ALY Change | Rank Change |
|---|---|---|---|---|---|---|
| Chicago Bears | 3.8 | 31 | 4.92 | 3 | +1.12 | +28 |
| Indianapolis Colts | 4.02 | 28 | 4.87 | 5 | +0.85 | +23 |
| Jacksonville Jaguars | 4.36 | 18 | 4.8 | 6 | +0.44 | +12 |
| New England Patriots | 4.05 | 27 | 4.29 | 18 | +0.24 | +9 |
| Los Angeles Rams | 4.65 | 9 | 5.19 | 1 | +0.54 | +8 |
| Dallas Cowboys | 4.6 | 11 | 4.88 | 4 | +0.28 | +7 |
| Seattle Seahawks | 4.08 | 26 | 4.27 | 19 | +0.19 | +7 |
| Buffalo Bills | 4.68 | 8 | 5.12 | 2 | +0.44 | +6 |
| Minnesota Vikings | 4.53 | 12 | 4.7 | 7 | +0.17 | +5 |
| Miami Dolphins | 3.69 | 32 | 3.96 | 28 | +0.27 | +4 |
| Denver Broncos | 4.53 | 13 | 4.55 | 10 | +0.02 | +3 |
| Pittsburgh Steelers | 4.37 | 16 | 4.5 | 13 | +0.13 | +3 |
| Houston Texans | 4.12 | 24 | 4.18 | 22 | +0.06 | +2 |
| Kansas City Chiefs | 4.47 | 14 | 4.51 | 12 | +0.04 | +2 |
| Washington Commanders | 4.27 | 19 | 4.31 | 17 | +0.04 | +2 |
| New York Giants | 4.17 | 21 | 4.18 | 21 | +0.01 | 0 |
| Tennessee Titans | 4.09 | 25 | 4.04 | 25 | -0.05 | 0 |
| Cincinnati Bengals | 4.39 | 15 | 4.31 | 16 | -0.08 | -1 |
| Cleveland Browns | 3.88 | 29 | 3.38 | 31 | -0.50 | -2 |
| Las Vegas Raiders | 3.85 | 30 | 3.38 | 32 | -0.47 | -2 |
| Los Angeles Chargers | 4.13 | 23 | 4.02 | 26 | -0.11 | -3 |
| Carolina Panthers | 4.73 | 6 | 4.67 | 8 | -0.06 | -4 |
| New Orleans Saints | 4.15 | 22 | 4.0 | 27 | -0.15 | -5 |
| Green Bay Packers | 4.72 | 5 | 4.52 | 11 | -0.20 | -6 |
| New York Jets | 4.37 | 17 | 4.08 | 23 | -0.29 | -6 |
| Detroit Lions | 5.08 | 1 | 4.62 | 9 | -0.46 | -8 |
| San Francisco 49ers | 4.68 | 7 | 4.38 | 15 | -0.30 | -8 |
| Philadelphia Eagles | 4.23 | 20 | 3.56 | 30 | -0.67 | -10 |
| Tampa Bay Buccaneers | 4.88 | 2 | 4.49 | 14 | -0.39 | -12 |
| Baltimore Ravens | 4.75 | 3 | 4.26 | 20 | -0.49 | -17 |
| Atlanta Falcons | 4.71 | 6 | 4.06 | 24 | -0.65 | -18 |
| Arizona Cardinals | 4.65 | 10 | 3.7 | 29 | -0.95 | -19 |
The Bears remain on top here. Seattle does much better in this metric, which might indicate the yards before contact issues are more attributable to other aspects of the run game. Minnesota checks in a few spots behind Seattle.
Finally, let’s look at run block win rate year-over-year changes from ESPN.
Year-Over-Year Change in Run Block Win Rate Rankings
2024–2025 NFL Season | Source: ESPN
Seattle makes the biggest gains in the run blocking via this metric. Like Adjusted Line Yards, this is more focused on the offensive line play than something like yards before contact. Rookie Zabel leads all interior linemen in this metric.
Minnesota ranks 7th in improvement. Darrisaw ranks 2nd and O’Neill ranks 9th, indicating that the improvement here is more about their availability and play than the new additions the Vikings made.
Chicago improved a bit here, and Thuney is the only linemen discussed here to rank in the Top 10 of both pass block win rate and run block win rate (7th).
Cumulative Gains
The one metric we have that assessed offensive line play in both pass blocking and run blocking is the ESPN Win Rate metric. We have seen how they look independently, this puts both together to see which teams improved the most across both metrics.
NFL O-LINE IMPROVEMENT RANKINGS
Total Rank Change: Pass Block + Run Block (2024 → 2025)
Seattle has made the largest cumulative jump in these rankings, while the Bears are 7th and the Vikings actually regressed while ranking 20th in overall change to OL play.
Cost
The Bears went with established veterans and that has paid off in a big way. It also is costly. Thuney signed a two year, $35.5M contract extension. Jackson signed a three year, $54.5M contract. Dalman took a three year, $42M deal in free agency. That’s $132M altogether.
Minnesota signed Fries to a five year, $87.7M deal with $44M guaranteed. Kelly signed a two year contract worth $18M.
The only meaningful non-rookie contract Seattle signed on the offensive line was an extension for Lucas that totaled $46M over three years.
2025 Offensive Line Spending by Team
NFL Salary Cap Allocations | Source: OverTheCap.com
Takeaways
Seattle took a riskier path by not adding a veteran. That was not their plan, as Fries was a priority free agent who spurned them for Minnesota. That decision, however, may have saved the team both in money and in headaches. Fries has allowed 24 pressures, 8th-most in the NFL among guards. Oft-maligned Seahawks right guard Bradford has allowed 20 pressures. Their overall pass blocking efficiency (96.8 vs 96.6) is roughly equivalent. Bradford is on his rookie deal, while Fries is one of the highest paid right guards in football.
The Seahawks also have the third-youngest starting offensive line, the second-cheapest, and have seen the biggest combined jump in pass block and run block win rates. All this while helping to power the 2nd-highest scoring offense in the NFL.
Their run offense remains a work in progress, but that might be a cost of going young and making large changes to scheme and coaching staff. It has the potential to pay off over the back portion of this season, and beyond.
Chicago has made a huge jump in record, powered in large part by this veteran interior offensive line. They lead the NFL in rushing yards per game, taking a huge burden off the shoulders of their young and developing quarterback. It is staggering that they have gone from allowing a league-high 68 sacks a year ago to ranking 7th in sack rate to this point.
Their commitment to plug-and-play veterans allowed them to coalesce quickly and feels more sturdy than what Seattle has done, at least for this season. Whether this group will stay together long enough for the Bears to contend might depend on the longevity of Thuney.
Minnesota has received a lot of criticism for their move at quarterback. Their offensive line strategy has backfired as well. Not only did they spend big free agent dollars, but they spent it on players with injury issues, which has reared its head this season. Fries was also a small sample size player, who was mostly a below average guard before his final season in Indianapolis, and appears to now be a drastically overpriced player. Jackson seems promising, which is also a reminder that they may have erred in not spending more draft capital on young linemen.
The biggest lesson from the different fortunes of these teams so far is that renovating an offensive line is as much about scheme, commitment to run game, and quarterback play as it is about personnel. In fact, it might be more important.
Seattle had the highest rate of five-man protections out of shotgun last season, putting maximum strain on their OL. Kubiak has changed that to the extreme, with plenty of extra blockers in and two man routes off play-action. The Seahawks have not even had to be a good running team in order to reap the rewards of a commitment to the run game. They have been the most explosive passing team in football all year.
The spotlight will always be on the quarterbacks and skill positions. Look up at the standing, though, and you will notice the teams at the top have found a way to craft high-performing offensive lines. Seattle and Chicago made moves this offseason that have vaulted their lines and their teams to the top of the NFC.