POWER RANKINGS
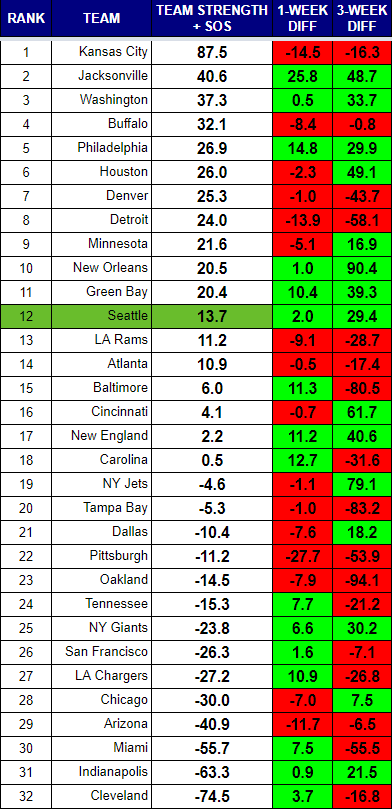
The Chiefs continue to dominate the NFL, with the best offense, and the toughest strength of schedule (SOS) thus far. Their defense, especially against the run, is showing some signs of weakness. They are allowing 4.6 yards per carry. Jacksonville has taken over the top defensive rank after a stellar performance in Pittsburgh, and are now allowing just a 56.9 passer rating to opposing quarterbacks. They have put up a lot of points (27.8 ppg), but Blake Bortles and the team passer rating of 77.1 would seem to severely limit their upside. The only other team in the top 15 with a lower passer rating is #15 Baltimore at 73.4.
Watch out for Denver, who would rank third if the SOS was removed from the equation. They have a good enough offense and a outlier rush defense (2.4 ypc). The Broncos might be the perfect nemesis for the Chiefs.
The Redskins are certainly tough to take seriously, but they are super efficient on offense (107.6 passer rating and 4.5 ypc), and mediocre on defense. Only the Chiefs, Patriots, Packers, and Saints have more efficient offenses so far. Their ranking is aided by a strong SOS.
The rankings properly identified the Bills as a sneaky tough team as early as week two. Their defense remains one of the best, and Tyrod Taylor is relatively efficient in his passing, if not particularly dangerous. The Texans would seem to be in trouble given their defense was already struggling before the injuries to J.J. Watt and Whitney Mercilus hit. They are allowing 26 ppg and a 97.5 passer rating. The offense is good enough to keep them in most games.
Odd ranking of the week has to go to the Saints at #10. Ahead of the Packers, Seahawks, Rams, and Falcons, among others. The ranking system likes them primarily because of their strong SOS. Only Houston and Kansas City have had tougher schedules so far. The Saints defense is terrible, and their ranking should fall in coming weeks.
The Seahawks remain outside the top 10, with a struggling offense lifted by a defense slowly climbing back toward the top of the charts. Their SOS has been weak, and pulling their ranking down a bit. That won’t change when they play the Giants, but will once they play teams like Houston, Atlanta, Philadelphia, and Jacksonville.
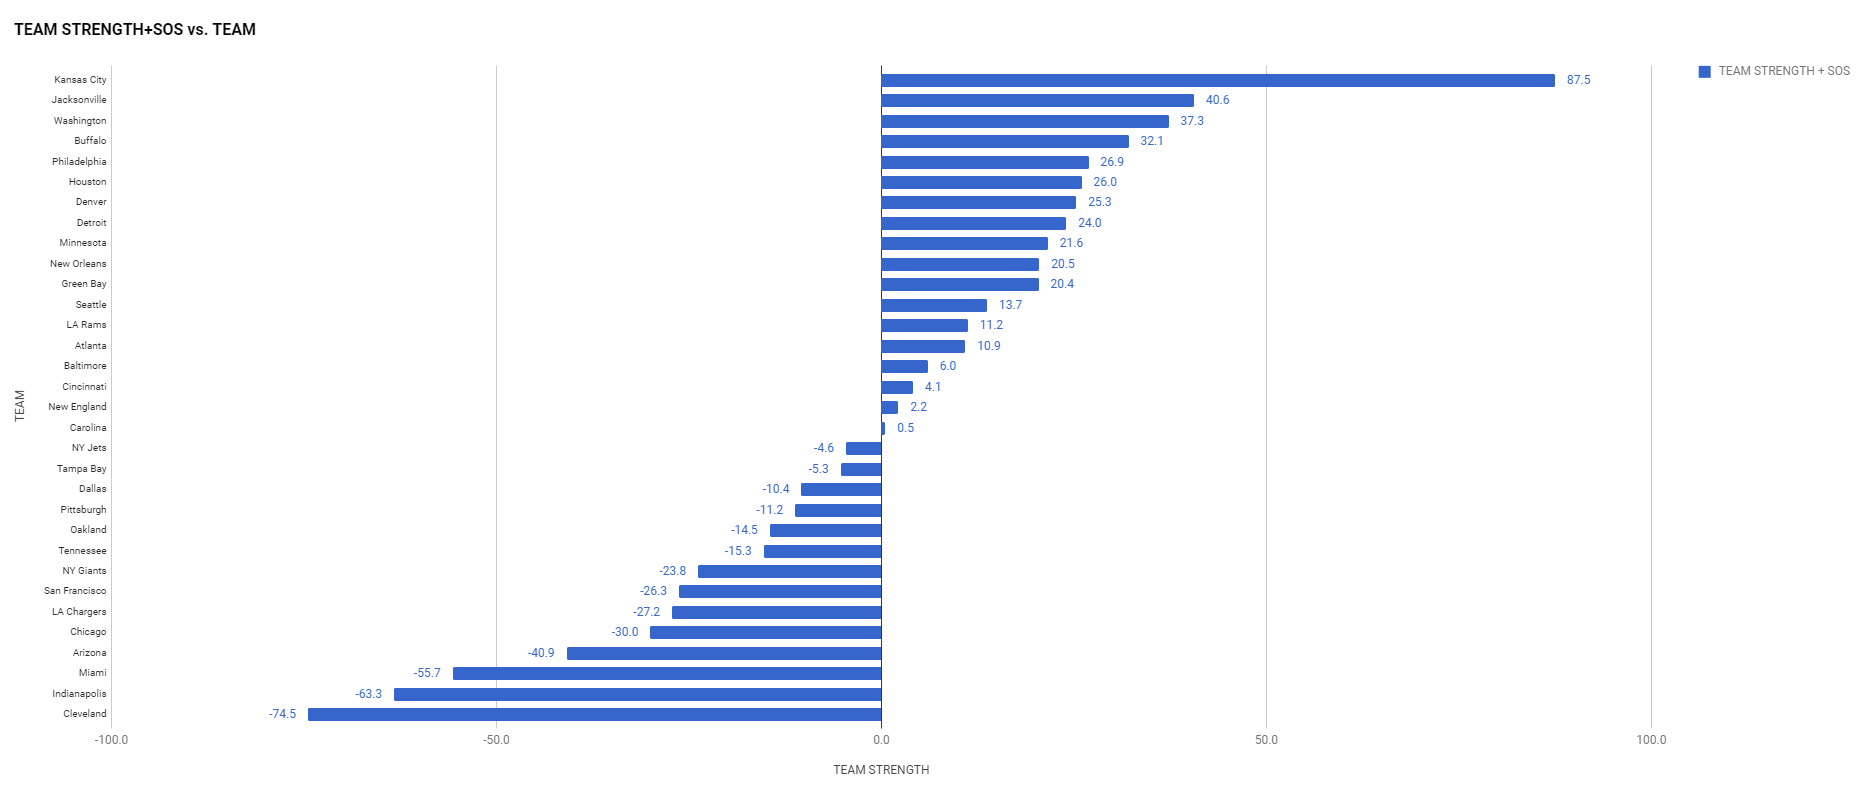
Rankings Visualization
I like this view as it shows tiers of strength that develop over the course of the season.
RANKINGS EXPLAINED
Power rankings are always debatable. I don’t buy into the gut feel methods most places use to determine their rankings, so I developed a formula a few years back that attempts to take at least some of the subjectivity out of the discussion. My approach was simple, I measured offensive and defensive efficiency based on the Yards Per Carry (YPC) and Yards Per Attempt (YPA), as well as points scored and points allowed. The formula to calculate “Team Strength” was as follows:
(YPC (offense) + YPA (offense) + Avg Pts/Game Scored) – (YPC (defense) + YPA (defense)+ Avg Pts/Game Allowed)
The formula has proven to be a pretty accurate predictor of success (roughly 70% of the teams ranked in the Top 10 by week 3 make the playoffs), but I am always looking for ways to improve it. I read a great article on ColdHardFootballFacts.com. There was one gem in there about predicting championship teams. The article mentioned passer rating differential as the “mother of all stats.” A full 69 of 72 champions have ranked in the Top 10 in this statistic. It is a stat after my own heart, as I believe offensive and defensive efficiency is the key measurable outside of point differential. Turnovers would factor in there as well, but I am not convinced a team has as much control over that. My power rankings use YPA and YPC differentials. I went ahead and replaced the YPA with offensive and defensive passer rating, to give me this:
(YPC (offense) + Passer Rating (offense) + Avg Pts/Game Scored) – (OPP YPC (defense) + OPP Passer Rating (defense)+ OPP Avg Pts/Game)