
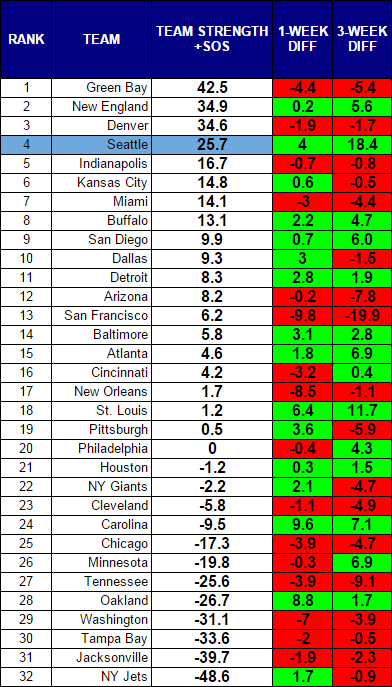
Seattle remains the story of these rankings. They have added an astounding 18.4 points of team strength in just three weeks. The next-closest team in that span are the St. Louis Rams that has added over 11 points. Consider that the Rams have beaten their last two opponents by a combined score of 76-0, and the Seahawks have still far outpaced them.
The rankings have consistently discounted the Eagles, and that proved an accurate depiction. As much as Seattle has gained, the 49ers have lost. In fact, they have lost more at 19.9 points of strength in just three weeks. There is no other team close to them, although, the Cardinals are the second-worst during that span.
RANKINGS (WITH SOS)
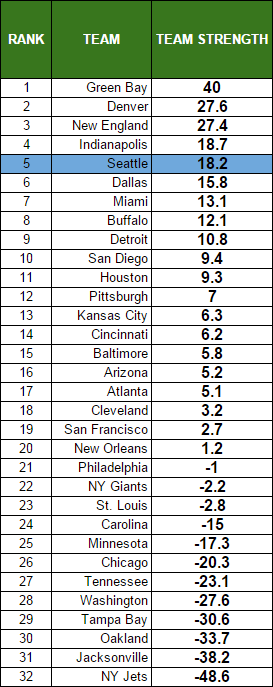
RANKINGS (WITHOUT SOS)
Scatter
This view helps to give you a view of how teams are grouped together. You will generally see tiers of strength develop as the season wears on.
.png) |
| CLICK TO ENLARGE |
RANKINGS EXPLAINED
Power rankings are always debatable. I don’t buy into the gut feel methods most places use to determine their rankings, so I developed a formula a few years back that attempts to take at least some of the subjectivity out of the discussion. My approach was simple, I measured offensive and defensive efficiency based on the Yards Per Carry (YPC) and Yards Per Attempt (YPA), as well as points scored and points allowed. The formula to calculate “Team Strength” was as follows:
(YPC (offense) + YPA (offense) + Avg Pts/Game Scored) – (YPC (defense) + YPA (defense)+ Avg Pts/Game Allowed)
The formula has proven to be a pretty accurate predictor of success, but I am always looking for ways to improve it. I read a great article on ColdHardFootballFacts.com. There was one gem in there about predicting championship teams. The article mentioned passer rating differential as the “mother of all stats.” A full 69 of 72 champions have ranked in the Top 10 in this statistic. It is a stat after my own heart, as I believe offensive and defensive efficiency is the key measurable outside of point differential. Turnovers would factor in there as well, but I am not convinced a team has as much control over that. My power rankings use YPA and YPC differentials. I went ahead and replaced the YPA with offensive and defensive passer rating, to give me this:
(YPC (offense) + Passer Rating (offense) + Avg Pts/Game Scored) – (OPP YPC (defense) + OPP Passer Rating (defense)+ OPP Avg Pts/Game)
As of September 23, 2014, I have added a strength of schedule component to the rankings as well.
![]()
