SEATTLE, WA - DECEMBER 27: Wide receiver Doug Baldwin #89 of the Seattle Seahawks reacts after scoring a touchdown in the third quarter against the St. Louis Rams at CenturyLink Field on December 27, 2015 in Seattle, Washington. The Rams defeated the Seahawks 23-17. (Photo by Otto Greule Jr/Getty Images)

Seahawks Start 13th In Power Rankings

POWER RANKINGS

Week one in the NFL is where overreactions reign supreme. The San Francisco 49ers are probably not the best team in the NFL. The Philadelphia Eagles are probably not the second best team in the NFL. Our week one power rankings, which are statistically driven to remove as much subjectivity as possible, really are a measure of which teams played the best in their first game.

Carolina ranked 16th after the first week last year and went on to win 15 games. Tennessee ranked first and the Rams ranked sixth. The eventual Super Bowl winners, Denver, were ranked eighth. Seattle, Minnesota and Washington all ranked 20th or worse and made the playoffs.

The Seahawks start this year at 13th, just above the midpoint. It might be surprising to see them above the Patriots, who won impressively in Arizona. That is largely due to a New England defense that struggled to slow down either the Cardinals pass efficiency (104.7) or run efficiency (4.8 YPC). It was not pretty, but the Seahawks had a positive pass, run and point differential. The Patriots were negative on the run differential.

Seattle is now headed off to play the team that had the worst statistical performance of week one in the LA Rams. We will find within the next few weeks if they really are as bad as they looked Monday night.

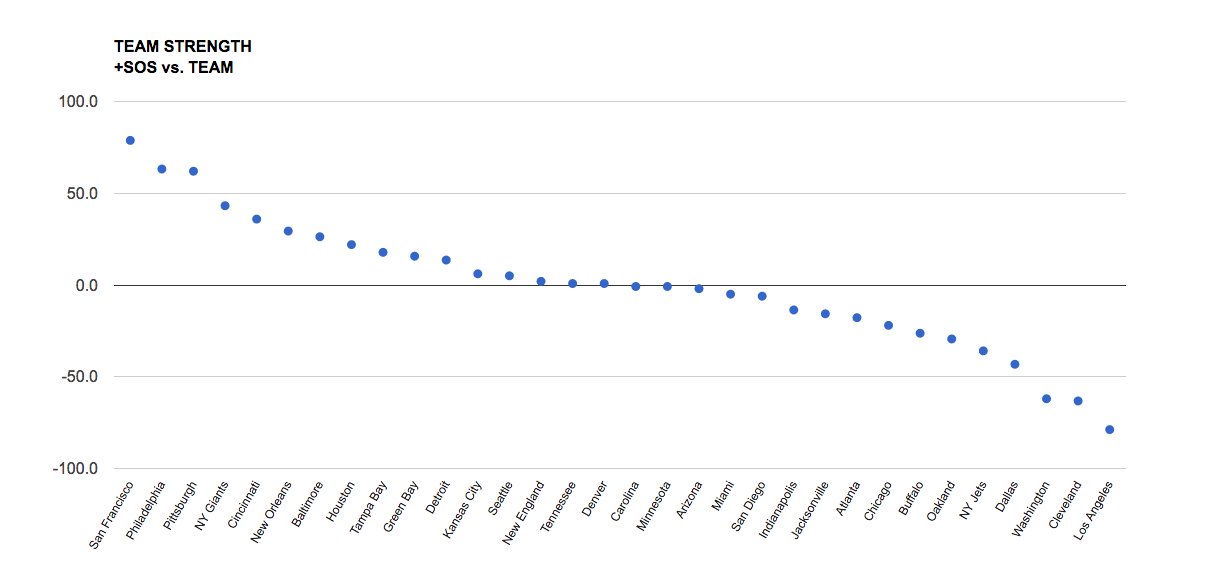
NOTE: I have decided to remove strength of schedule from the rankings until week two or three when there is a little more logic to SOS calculations.

Rankings Table

Week 1 NFL Power Rankings

Scatter chart

screen-shot-2016-09-13-at-5-42-33-am

RANKINGS EXPLAINED

Power rankings are always debatable. I don’t buy into the gut feel methods most places use to determine their rankings, so I developed a formula a few years back that attempts to take at least some of the subjectivity out of the discussion. My approach was simple, I measured offensive and defensive efficiency based on the Yards Per Carry (YPC) and Yards Per Attempt (YPA), as well as points scored and points allowed. The formula to calculate “Team Strength” was as follows:

(YPC (offense) + YPA (offense) + Avg Pts/Game Scored) – (YPC (defense) + YPA (defense)+ Avg Pts/Game Allowed)

The formula has proven to be a pretty accurate predictor of success, but I am always looking for ways to improve it. I read a great article on ColdHardFootballFacts.com. There was one gem in there about predicting championship teams. The article mentioned passer rating differential as the “mother of all stats.” A full 69 of 72 champions have ranked in the Top 10 in this statistic. It is a stat after my own heart, as I believe offensive and defensive efficiency is the key measurable outside of point differential. Turnovers would factor in there as well, but I am not convinced a team has as much control over that. My power rankings use YPA and YPC differentials. I went ahead and replaced the YPA with offensive and defensive passer rating, to give me this:

(YPC (offense) + Passer Rating (offense) + Avg Pts/Game Scored) – (OPP YPC (defense) + OPP Passer Rating (defense)+ OPP Avg Pts/Game)

As of September 23, 2014, I have added a strength of schedule component to the rankings as well.
Founder, Editor & Lead Writer
  1. Just looking at your explanation…

    “The formula has proven to be a pretty accurate predictor of success, but I am always looking for ways to improve it. I read a great article on ColdHardFootballFacts.com. There was one gem in there about predicting championship teams. The article mentioned passer rating differential as the ‘mother of all stats’. A full 69 of 72 champions have ranked in the Top 10 in this statistic.”

    What do you mean by “predictor”? For example, I would certainly expect that straight point differential — which takes into account the play of the special teams, as well as intangible factors such as officiating and luck — would correlate more highly with won/loss record and playoff success. Turnover differential might do so as well.

    But any statistic or ranking which compares its end-of-year performance with a team’s overall performance is really just telling us what we already knew: These teams were good this year, those teams were not. The true predictive value of a ranking system should be judged upon its ability to determine *early in the season* which teams will rise to the top. More to the point, is there any single ranking system which can, at any given point in the system, better predict the eventual Superbowl champion than Vegas’ futures odds?

    Football Outsiders at least *attempts* to do this, with its weekly Playoff Odds Report — but I don’t know whether they track the tool’s actual performance. (And, besides, they don’t even compare their odds with Vegas’ implied odds.)

    So, if a ranking system isn’t truly predictive, then, what is the point of it? The Seahawks have won Football Outsiders’ DVOA crown four years running, along with a single Superbowl championship. It could be argued that there *ought* to be a trophy given for sustained multi-year success independent of the aforementioned officiating/luck/schedule factors (which is more less what DVOA measures). But as there isn’t, a team’s won/loss record and playoff performance is really the only ranking system we need at year’s end.

    1. All fair questions. I don’t claim there is a causal relationship between these rankings and winning a Super Bowl. I talk about success as making the playoffs. Around 70% of the teams ranked in the Top 10 of these rankings in Week 3 wind up in the playoffs by year’s end. It has effectively surfaced quality teams that were obscured by win-loss record and also identified some fluff teams who were inflated. You will find these ranking track quite closely to DVOA except I don’t call it DVOA. I also am transparent in how I arrive at this instead of attempting to make it proprietary.

      In the end, it’s all in good fun. Either they are right or they are wrong. It’s the discussion and debate that are desired outcomes.

Comments are closed.