POWER RANKINGS
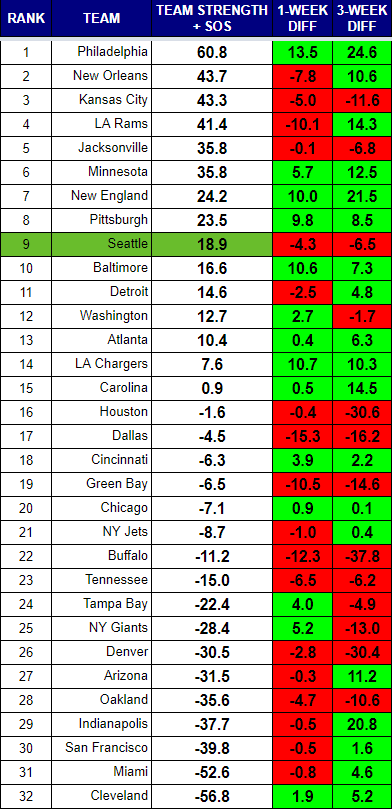
Brace for obnoxious Eagles fans. They are bad enough when their team is their typical pretender selves, but now they have taken a firm grip on the top ranking. You may question whether a team led by a second-year quarterback can truly contend. Look no further than Russell Wilson in 2013 for your answer. The Eagles defense is not what that Seahawks defense was, but the Eagles offense is stronger.
The Saints are a true threat in the NFC. Their offense is balanced and explosive. Their defense has been opportunistic, but has to be holding their breath with the Marshon Lattimore injury. He’s been a great addition. Kansas City continues to slide, and don’t look now, but the Patriots are making a strong run up the charts.
I tend to believe the strongest overall unit in the NFL wins the day in the playoffs. It is hard to bet against an offense led by Tom Brady being the best overall unit in the NFL. New Orleans and Philadelphia are statistically stronger, so are at least in the mix. The Jaguars defense is the other contender for strongest overall unit. They are dominant, and easily the best defense in the league this year. Are they good enough to help Blake Bortles beat Brady in a playoff game? That seems unlikely.
As frustrated as Seahawks fans are with their team and their prospects, the fundamentals still imply this is a dangerous team. That may say more about overall degradation of the level of play in the NFL, as it does about the Seahawks. Either way, they are significantly behind the top teams in terms of team strength.
Rankings Visualization
This view shows tiers of strength that develop over the course of the season.

RANKINGS EXPLAINED
Power rankings are always debatable. I don’t buy into the gut feel methods most places use to determine their rankings, so I developed a formula a few years back that attempts to take at least some of the subjectivity out of the discussion. My approach was simple, I measured offensive and defensive efficiency based on the Yards Per Carry (YPC) and Yards Per Attempt (YPA), as well as points scored and points allowed. The formula to calculate “Team Strength” was as follows:
(YPC (offense) + YPA (offense) + Avg Pts/Game Scored) – (YPC (defense) + YPA (defense)+ Avg Pts/Game Allowed)
The formula has proven to be a pretty accurate predictor of success (roughly 70% of the teams ranked in the Top 10 by week 3 make the playoffs), but I am always looking for ways to improve it. I read a great article on ColdHardFootballFacts.com. There was one gem in there about predicting championship teams. The article mentioned passer rating differential as the “mother of all stats.” A full 69 of 72 champions have ranked in the Top 10 in this statistic. It is a stat after my own heart, as I believe offensive and defensive efficiency is the key measurable outside of point differential. Turnovers would factor in there as well, but I am not convinced a team has as much control over that. My power rankings use YPA and YPC differentials. I went ahead and replaced the YPA with offensive and defensive passer rating, to give me this:
(YPC (offense) + Passer Rating (offense) + Avg Pts/Game Scored) – (OPP YPC (defense) + OPP Passer Rating (defense)+ OPP Avg Pts/Game)