
At the bottom of every set of HB Power Rankings I have ever published sits the same sentence:
The formula has proven to be a pretty accurate predictor of success, but I am always looking for ways to improve it.
I have been writing that line for years. This offseason I finally went and did it.
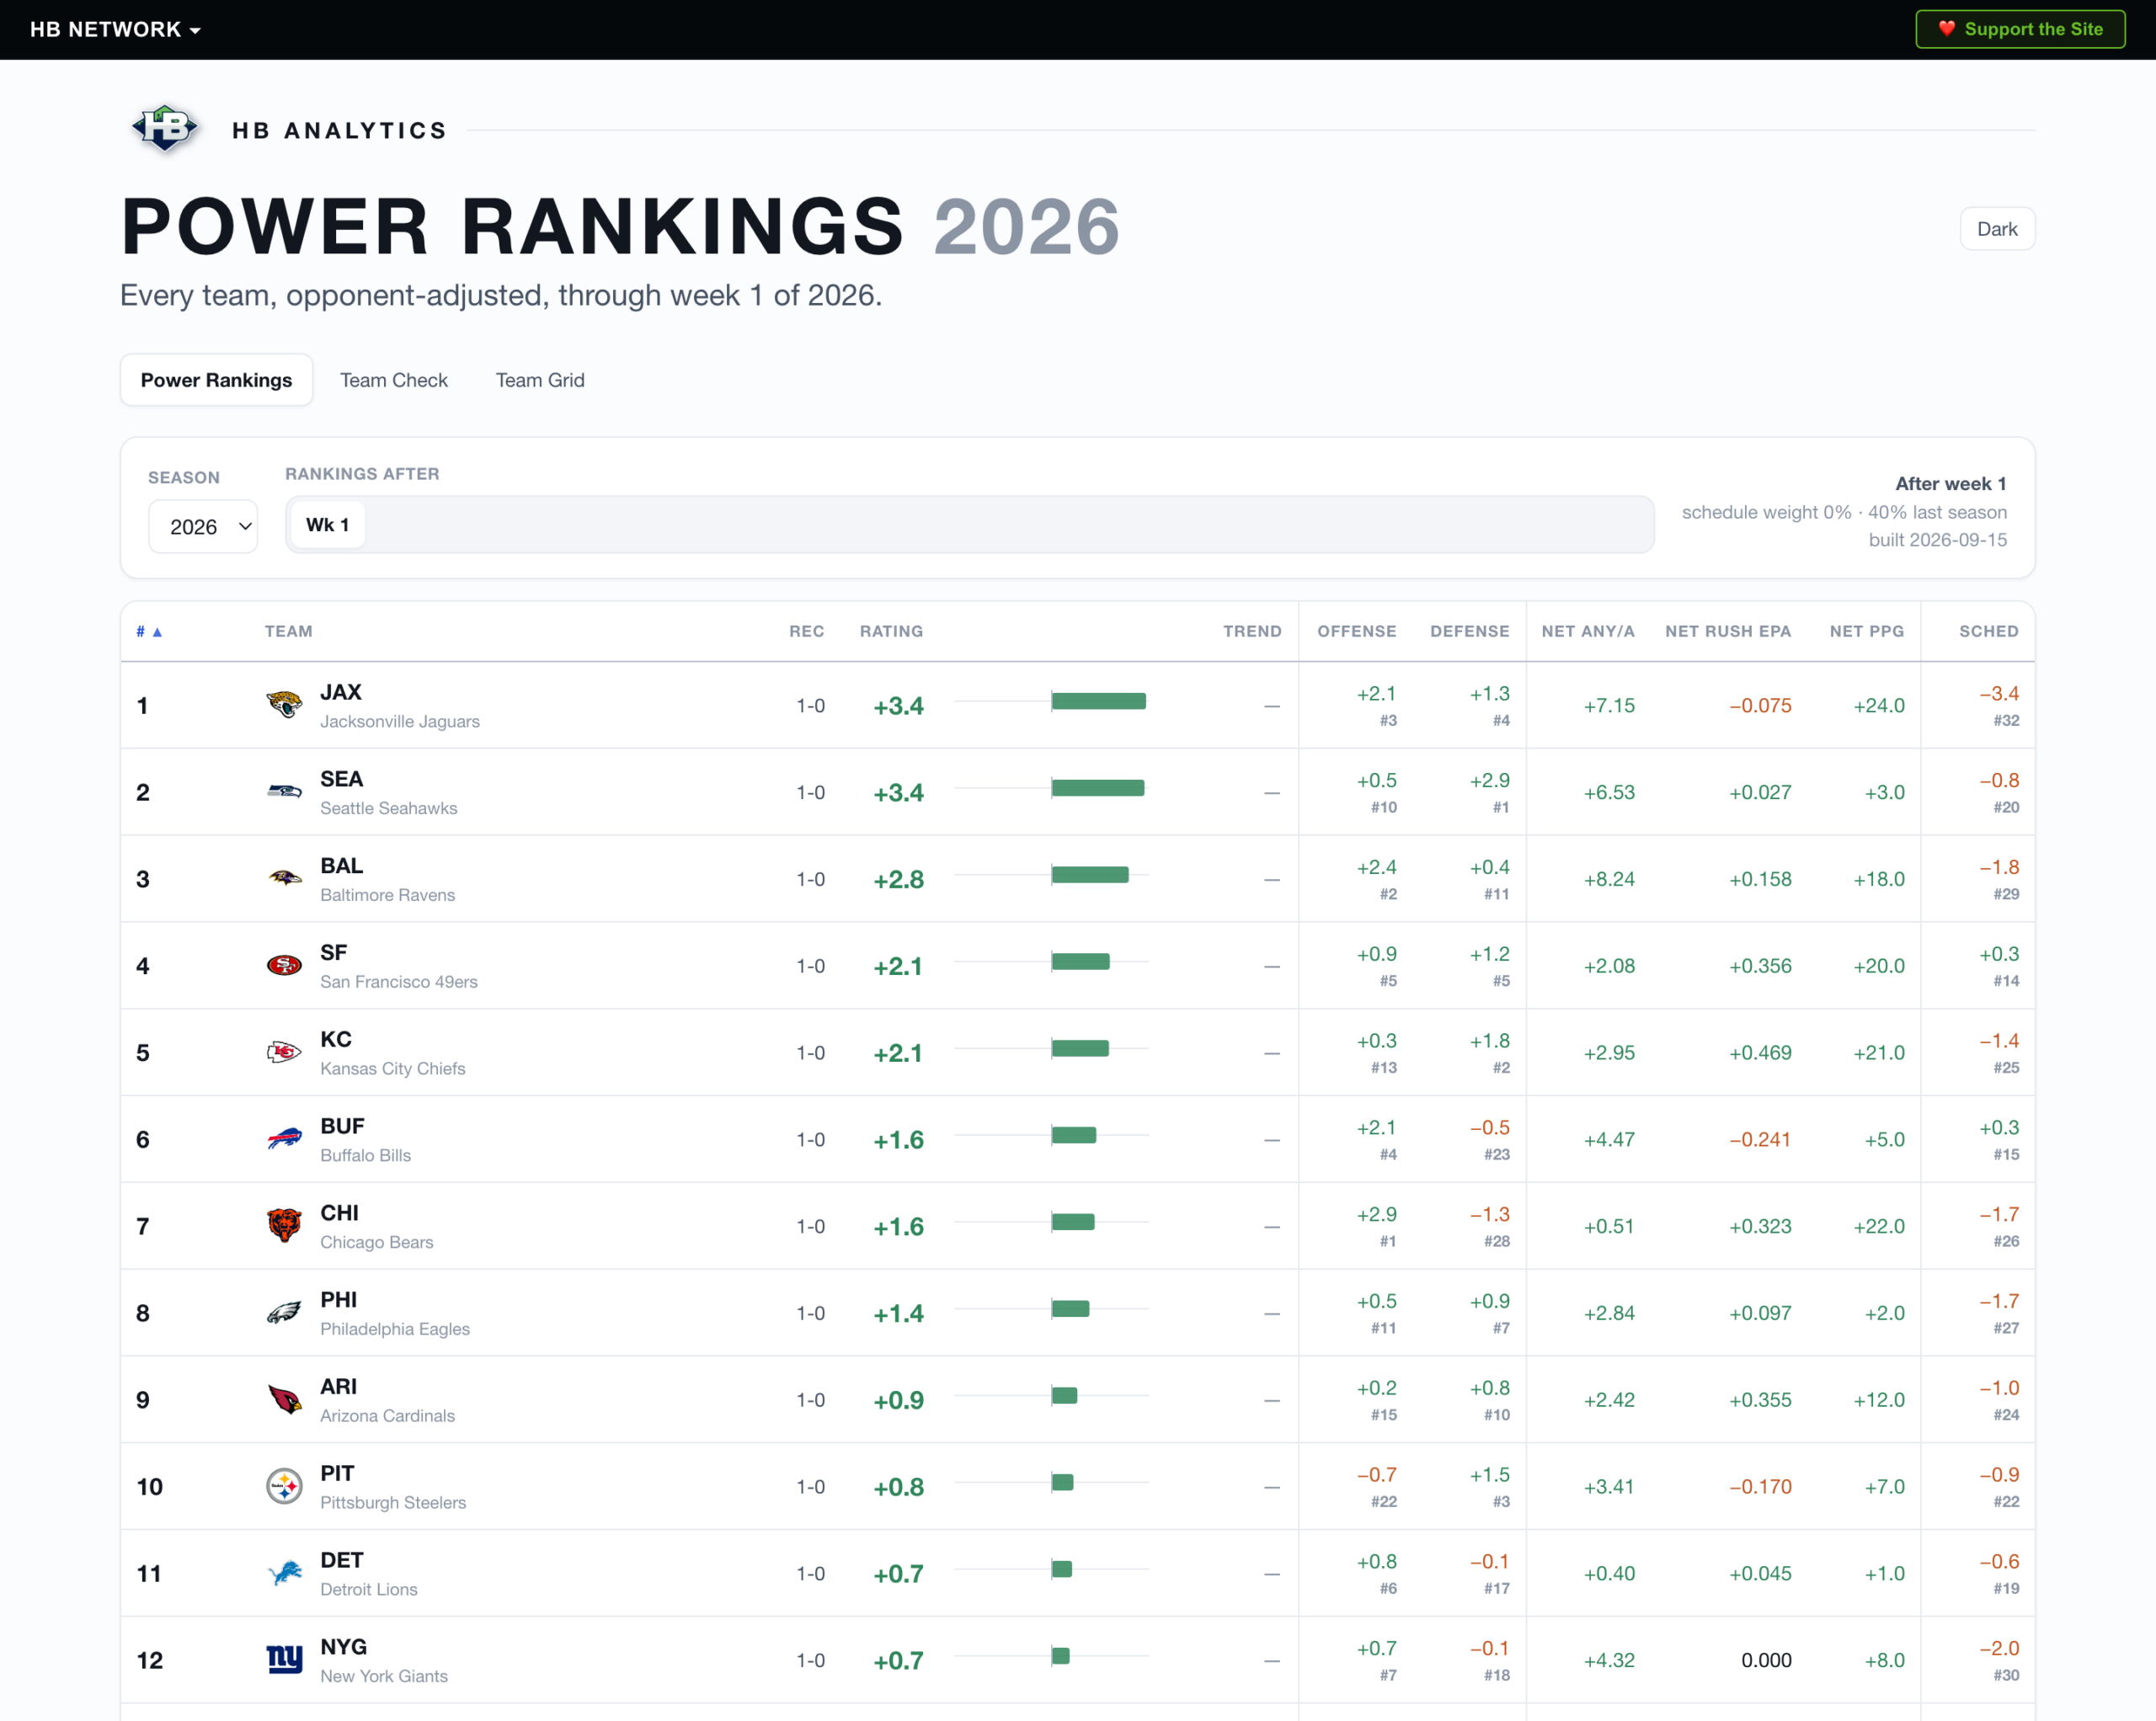
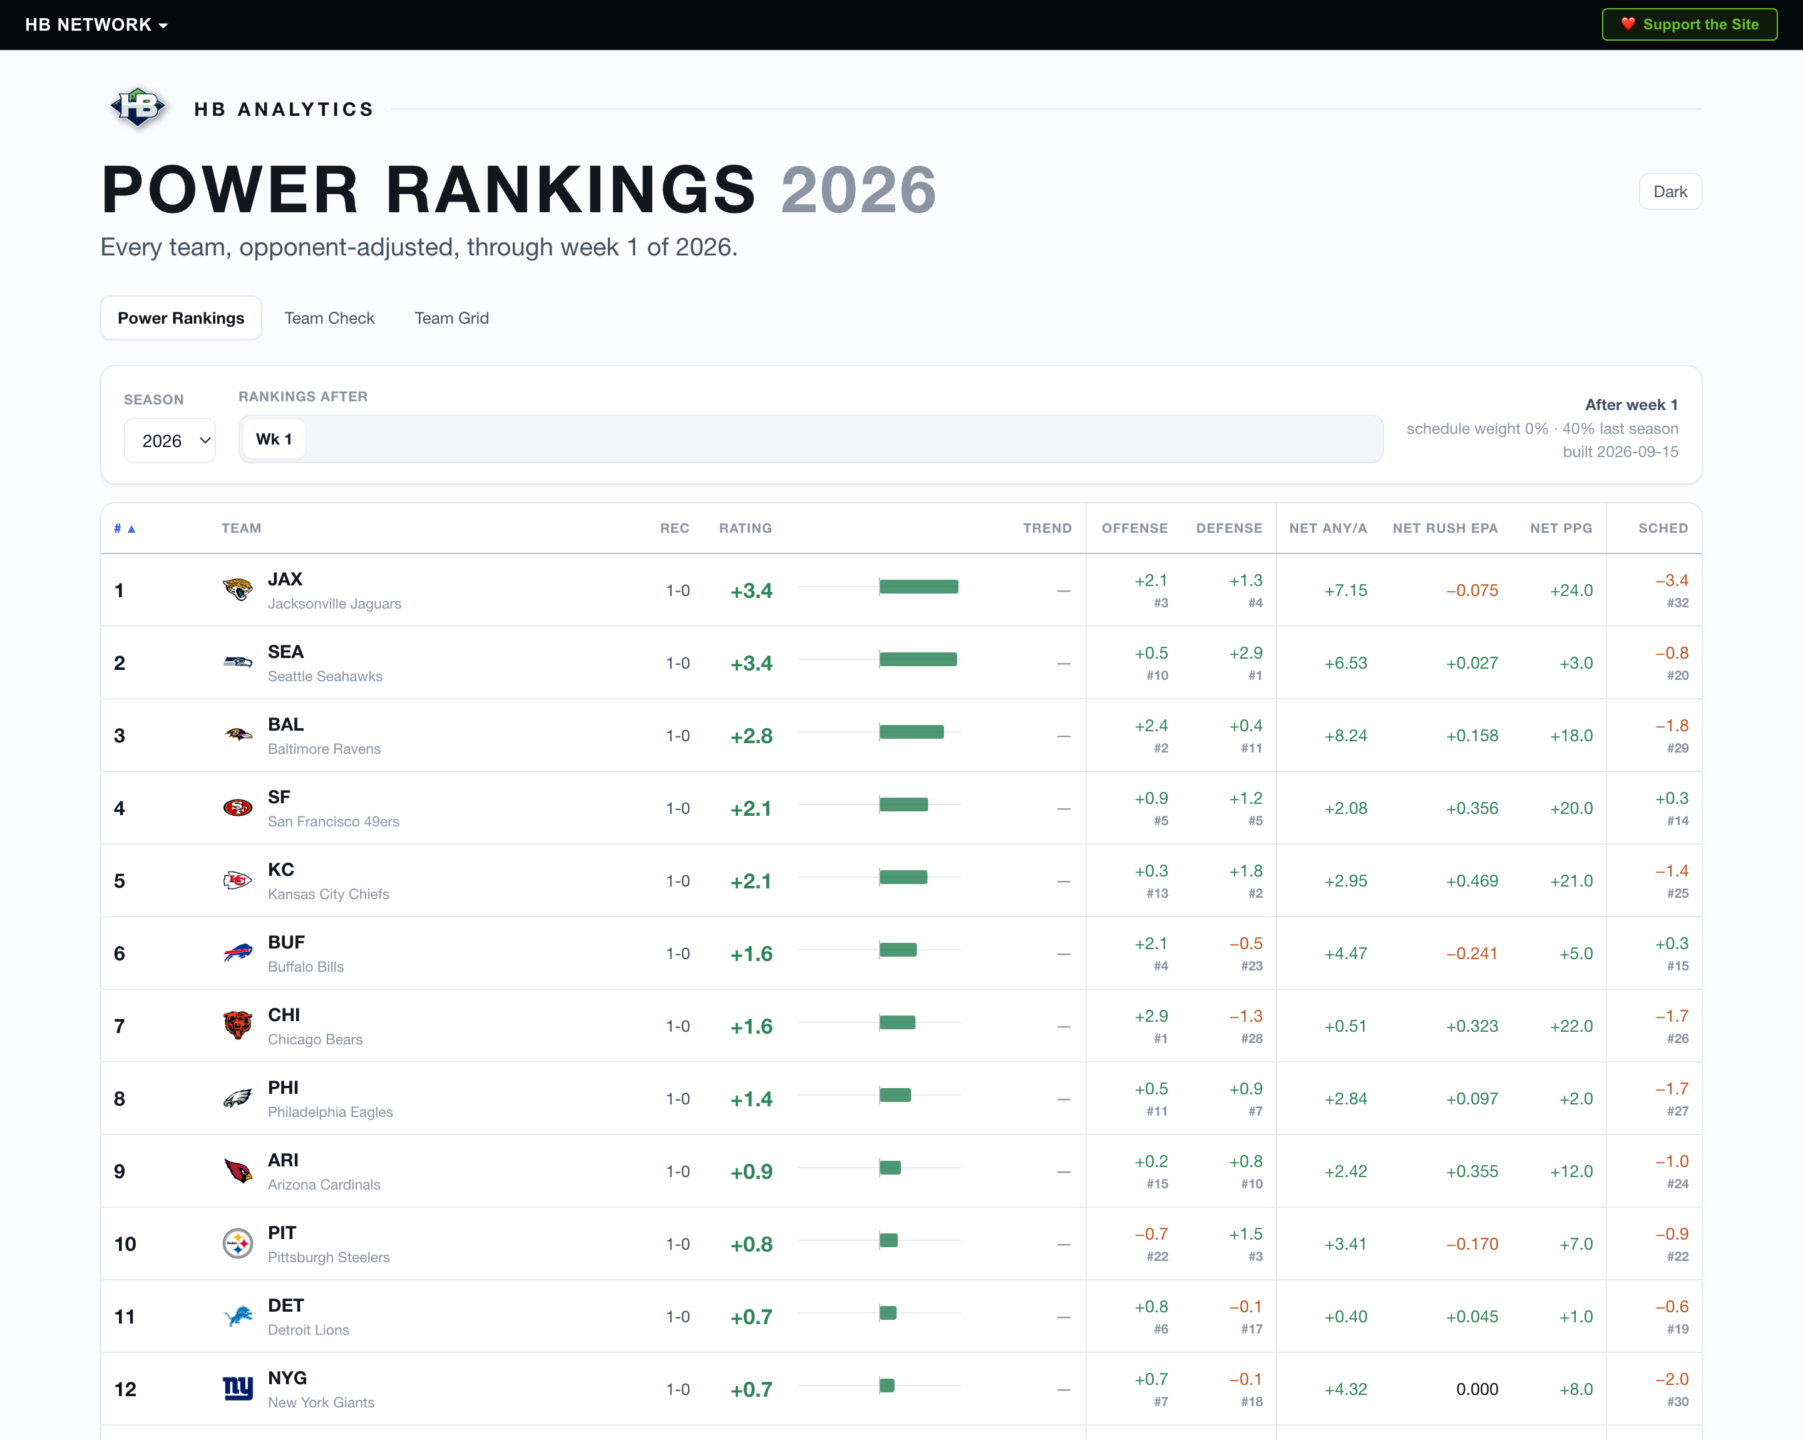
After a two-year hiatus, the HB Power Rankings are back, they have a permanent home at stats.hawkblogger.com, and every open question I have raised in a rankings post over the last decade now has an answer with evidence behind it.
What the rankings used to be
For anyone who has not seen one of these before, here is the formula I have been running since roughly forever:
(Rush EPA offense + Passer Rating offense + Avg Points Scored) minus (Rush EPA defense + Opponent Passer Rating defense + Avg Points Allowed), times strength of schedule
Three things you do, minus the same three things you allow, adjusted for who you played. Passing weighted more heavily than running. It worked. Roughly 70% of the teams sitting in the Top 10 after Week 3 made the playoffs, which is better than most of the gut feel lists you will read on a Tuesday.
But I never knew if the weights were right. I picked them. They were reasonable, and reasonable is not the same as correct.
Now the weights had to earn their spots
I tested the formula against every season back to 2015. The method is simple: rate all 32 teams through a given week, then check how well those ratings predicted the margin of every game those teams had left. Change one weight, run it again, see if it got better or worse.
Some of what came back was reassuring. When I swapped Yards Per Carry out for Rush EPA in 2024, I wrote that it might take a while to find the right weighting. Turns out the weight I picked on instinct was the peak. I tested it at zero, half, double and triple, and my original guess won. I will take it.
Some of it was less flattering. I dropped each of the three pieces in turn to see which was carrying the load, half expecting points per game to be doing all the work. It was not. Take out any one of the three and the rankings get measurably worse. All three earn their keep.
And one piece had to go.
Passer rating cannot see a sack
This bothered me for a long time and I never did anything about it.
Passer rating is completions, yards, touchdowns and interceptions per attempt. A third and eight strip sack is not an attempt. It does not appear. One of the single most damaging plays in football is invisible to the metric I was using to measure passing.
So the rankings now use adjusted net yards per attempt instead, which counts sacks and the yardage they cost. It sits on the same scale, so nothing else in the formula had to move. It made the rankings better at predicting games, and more importantly it made them honest about pass protection.
The strength of schedule problem I wrote about and then ignored
In the 2024 Week 1 rankings I wrote:
SOS itself will gain efficacy as the season goes on, which is why most rankings do not use it this early.
And then I applied it from Week 1 anyway, because I thought everyone else was being lazy.
They were not. I was wrong, and the backtest is blunt about it. Adjusting for strength of schedule at full weight in Week 2 makes the rankings worse than not adjusting at all. It is not close. By Week 12 it is clearly better. The reason is obvious once you say it out loud: adjusting for your opponent means adjusting based on how good you currently think that opponent is, and in September nobody knows anything.
So the schedule adjustment now starts at zero and climbs to full weight by Week 10. The dial turns up as the league learns who it is.
The New Orleans problem
Also from that 2024 post:
New Orleans played an awful Panthers team, but blew them out by such a large margin that the rankings are not going to be able to compensate.
That was me describing a flaw and shrugging at it. Two things fix it now.
First, ratings shrink toward the middle when there is not much to go on. A 2-0 team does not get to be a fifteen point favorite in September just because it beat somebody 44-10. The spread widens as the season earns it.
Second, the early weeks lean on how last season finished. About a third of the rating in Week 2, gone entirely by Week 9. That was the single biggest accuracy improvement of everything I tried, and it is the reason I no longer have to write my other recurring disclaimer, which was that these rankings are worth ignoring until after Week 3. Week 1 means something now.
You can see both at work today. Seattle sits second after one game, and that is last season’s Super Bowl run doing some of the lifting, plus a defense that held Drake Maye to 1.47 adjusted net yards per attempt. The 13 points on offense are keeping them out of the top spot. The board can hold all three of those thoughts at once.
The number finally means something
The old rankings spat out a Team Strength figure. Tampa at -39.7. Houston at -53.5. I would quote those numbers in posts and you would nod along, but neither of us could tell you what -39.7 actually was.
Now the rating is points per game against an average team on a neutral field. That is it. A +7 team beats a -3 team by about ten on neutral turf. Add roughly two points if they are home.
Which means my own favorite rule of thumb now reads straight off the board. I have written many times that scoring ten more points per game than your opponent is the mark of a genuine contender. You no longer have to go find that number. It is the number.
It is a page now, not a Tuesday post
This is the part I am most pleased with.
The rankings are no longer something I publish when I get to it. They update every day during the season, usually by early morning Pacific, once the previous night’s play by play has posted.
There is a week selector across the top. Click any week and the board rebuilds exactly as it stood at that moment. You can walk the whole season forward and watch the tiers form. You can go back through previous seasons the same way.
Miguel left a comment on the Week 3 rankings in 2024 asking for a column showing the previous week’s ranking so you could see what moved. Sorry it took two years, Miguel. There is a movement column now, and every team has a small chart tracking where its rating has been all season.
Two more pages came with it
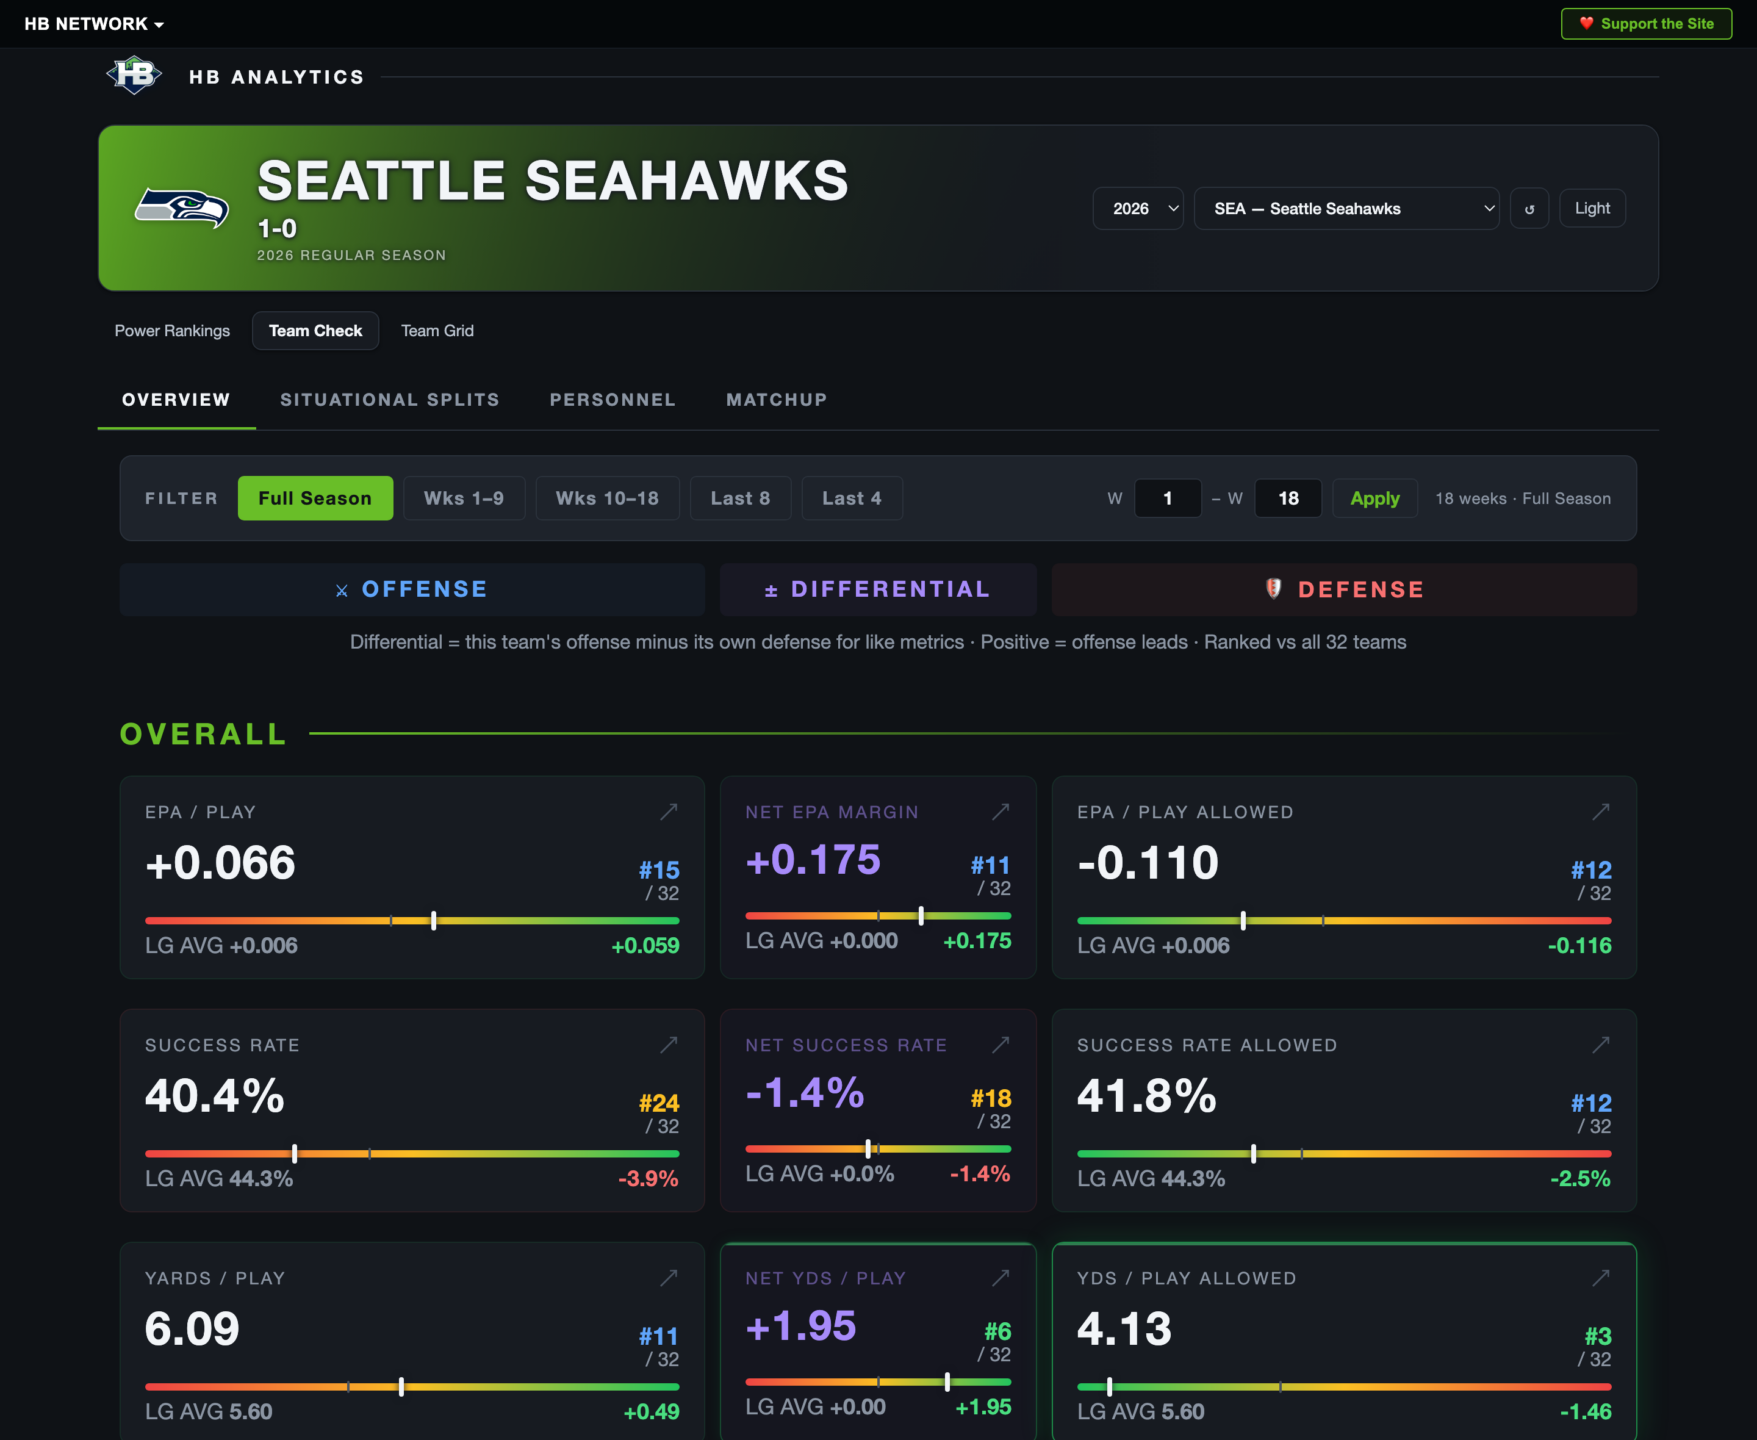
Team Check is the deep dive. Pick any team and you get 60 metrics, offense on the left, defense on the right, the difference between them down the middle, all ranked against the other 31. Filter by any week range you want. Full season, first half, last four, or a custom stretch you type in. There are tabs for situational splits, personnel groupings, and a head to head matchup view.
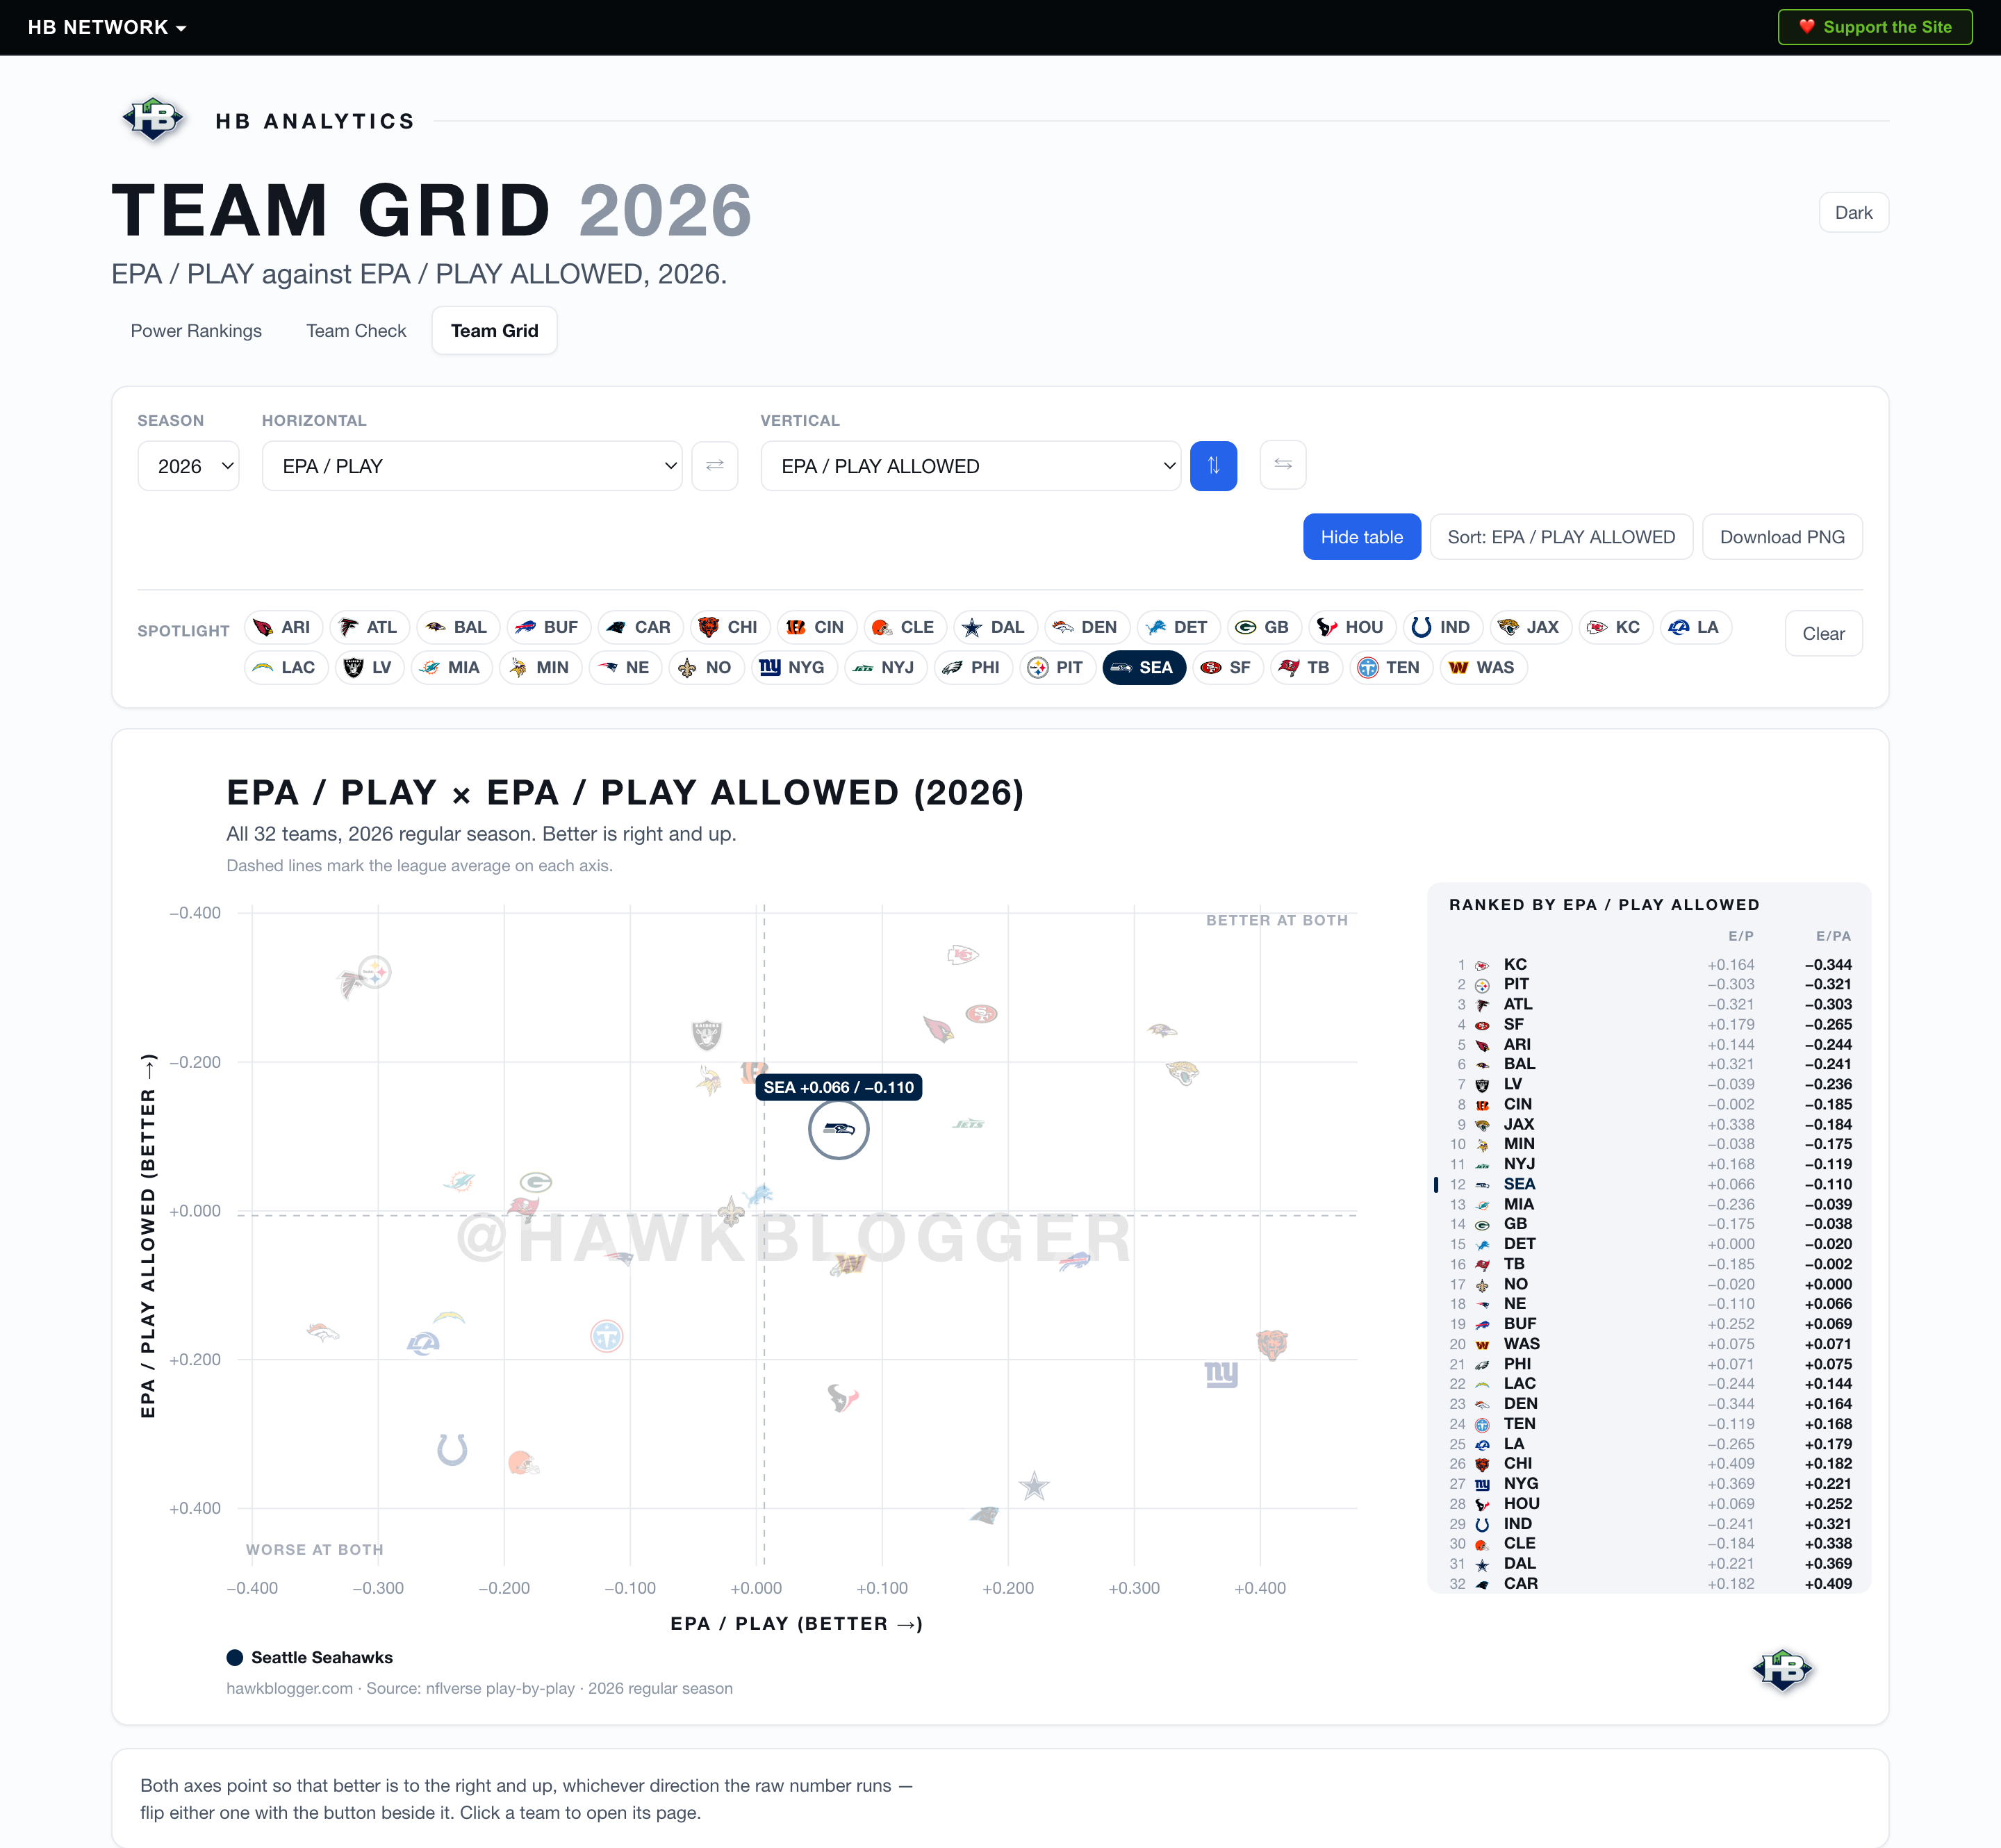
Team Grid plots any two team metrics against each other for all 32 teams at once. There are 57 metrics to pick from. Dashed lines mark the league average on each axis, which carves the league into quadrants, and better is always to the right and up no matter which direction the raw number runs. You can spotlight a team and watch the rest fade back, and you can download the whole chart as an image. If you want to win an argument with a picture instead of a paragraph, that now takes about four seconds.
What it still cannot do
This is not a betting model and I want to be clear about that. Across the last decade, the difference between two teams’ ratings predicts game margins at a correlation of about .34. The Vegas line does about .48. The market is better at this than I am and it is not remotely close.
It does not know your left tackle is out. It does not know the weather. It does not filter garbage time yet, which is the next thing on my list.
What it does is take the same public play by play everybody can see and turn it into a ranking that will tell you exactly why it thinks what it thinks. Every weight in it had to beat the alternatives to get there.
That sentence at the bottom of every rankings post is still true. I am still looking for ways to improve it. But for the first time, when somebody asks me why a team is seventh instead of fourteenth, I can actually answer.
Go Hawks!
-Brian