

Previous Articles In Series:
Ground Rules:
- No player comparisons: Generalities about players are irrelevant because they are just opinion. Number of Pro Bowlers or Hall of Famers often reflects popular opinion more that actual talent. Should someone want to quantify the quality of each player at each position and aggregate the total talent, I would love to read it. Until then, we will look at the whole team performance.
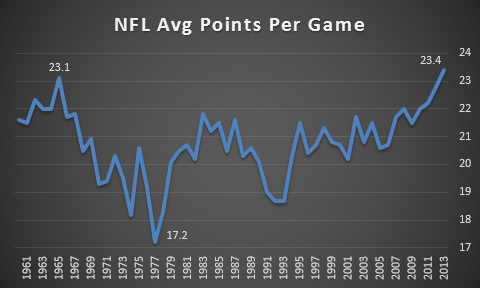
- Relative > Absolute: A team that holds opponents to 11.4 points per game (ppg) sounds better than a team that holds opponents to 14.2 ppg. But when the average offense scored 15 ppg in the year of the first team and the average offense scored 27 ppg in the year of the second team, the judgment should shift. We will heavily slant toward how the team performed in the era/year in which they played. This will also help to account for rule changes.
- Quality of opponent matters: A team that has the best opponent scoring average in the league, and does it during a year when scoring is way up sounds dominant. But what if they played in the 2005 NFC West? Who you play, and how you perform against those opponents needs to be taken into account.
- Strength of offense: A defense that has to make up for a horrible offense gets extra credit. We will compare the offenses these defenses played with at a high level.
- Championships: It should not be the ultimate arbiter, but it does have to be factored in. A defense that ends the year as a champion deserves credit for the ultimate accomplishment, and one that fails in that game deserves additional scrutiny.
- Analysis versus facts: I will give my opinion at the end of each article about which defense was superior and why. You may come to a different conclusion. The facts should not be disputable. My interpretation of them is open to debate.
Why the 1976 Steelers
Round 1: Yards Allowed
| Team | League Avg Yards/Game | Opponent Yards/Game | Std Dev | League Rank |
| 1976 Steelers | 302.7 | 237.4 | -1.5 | 1 |
| 2013 Seahawks | 348.5 | 273.6 | -1.95 | 1 |
Looking at gross yards allowed gives an overview, but it is important to look at yards surrendered per play. A defense that is on the field longer because their offense cannot move the ball will face more plays and more total yards allowed. They should not be penalized for it.
| Team | League Avg Yards/Play | Opponent Yards/Play | Std Dev |
| 1976 Steelers | 4.6 | 3.8 | -1.5 |
| 2013 Seahawks | 5.34 | 4.4 | -2.1 |
Even when zooming to the per play level, the Seahawks separate themselves from the Steelers. This round is solidly in the Seahawks favor.
Round 2: Points Allowed
| Team | League Avg Points/Game | Opponent Points/Game | Std Dev | League Rank |
| 1976 Steelers | 19.2 | 9.9 | -1.9 | 1 |
| 2013 Seahawks | 23.4 | 14.4 | -2.1 | 1 |
This one is closer. Holding teams below 10 points per game in any era is remarkable. Seattle has a slight edge here in relative numbers, but not enough to give them an edge over the absolute number Pittsburgh put up. Let’s take a look at scoring per play to see if the picture gets clearer.
| Team | League Avg Points/Play | Opponent Points/Play | Std Dev |
| 1976 Steelers | 0.290 | 0.159 | -1.9 |
| 2013 Seahawks | 0.360 | 0.233 | -2.05 |
Round 3: Schedule
| Team | Aggregate Opponents PPG | Opponent PPG | Std Dev |
| 1976 Steelers | 19.3 | 9.9 | -1.9 |
| 2013 Seahawks | 22.1 | 14.4 | -2.5 |
The Steelers 14 regular season opponents scored an average of 19.3 points per game, right at the league average (19.2). Seattle faced opponents who averaged slightly below the league average (23.4). Seattle fared better in relative numbers, but the Steelers faced stronger relative opponents. In other words, Pittsburgh faced teams that, in aggregate, were at the league average in scoring that year while Seattle faced teams slightly below the league average. Seattle has enough of a lead in standard deviations below the norm to be a bit in front of the Steelers here.
Let’s step away from the regular season for a moment though and just see how both teams did against the best offenses in the league that year. The best versus the best.
| Team | GMs VS TOP 10 OFF (incl playoffs) | +/- Opp Avg |
| 1976 Steelers | 7 | -9.4 |
| 2013 Seahawks | 3 | -19.9 |
Pittsburgh faced a bunch of top offenses. They did not do wonderfully against them. Their points allowed per game rose from their average of 9.9 to 15.8. The Seahawks dropped their average from 14.4 to 10.0 against the best offenses, including their dominant Super Bowl performance against the best offense in history.
Both teams get credit for winning a Super Bowl, even though this particular Steelers team did not make it to the championship. Still, Seattle wins this round on the strength of how they stepped up against the best competition and held their specific regular season opponents farther below their typical output.
Round 4: Takeaways
| Team | League Avg Takeaways/Game | Takeaways/Game | Std Dev | League Rank |
| 1976 Steelers | 2.5 | 3.3 | 1.4 | 5 |
| 2013 Seahawks | 1.6 | 2.4 | 2.3 | 1 |
Pittsburgh is far behind here. They took the ball away far more often, but so did everyone else in the 70s. They were not even the best in the league at doing so, ranking 5th in the NFL. Seattle easily wins this round.
Round 5: Offenses
Let’s take a look at just how much help or harm the other side of the ball did to these defenses. Admittedly, I will not go is deep here or else this would turn into an equally long assessment of each offense. Instead, we will stick to some absolute numbers and get some relative information via league rankings.
| Team | OFF PPG | OFF PPG Rank | OFF YDS/GM | OFF YDS/GM Rank | TO/GM | TO/GM Rank |
| 1976 Steelers | 24.4 | 5 | 331.2 | 9 | 2.21 | 7 |
| 2013 Seahawks | 26.1 | 8 | 339 | 17 | 1.19 | 4 |
Terry Bradshaw, Lynn Swann, Franco Harris, and the rest were among the better offenses in the NFL. There were top ten in scoring and yards for seven straight seasons from 1974-1980. Sure, they were helped by a dominant defense, but that defense was helped a lot by that offense as well. Seattle gets a slight bump here as their offense was a tick below what the Steelers ran out there.
Winner: 2013 Seattle Seahawks
![]()