NFL Power Rankings — Patriots Ascend to Top Spot, Seahawks Hanging Tough

POWER RANKINGS

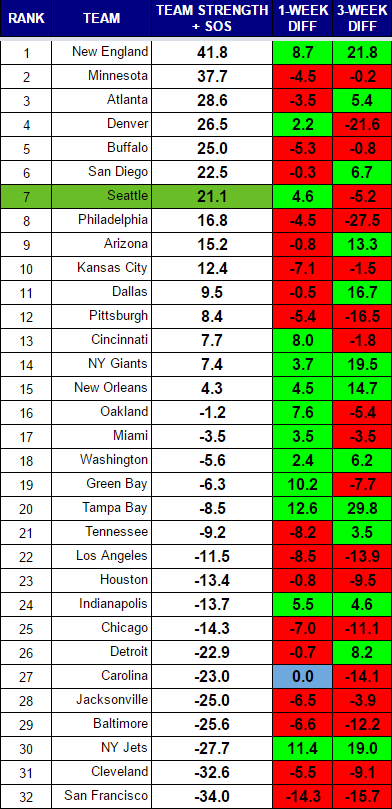
The team that appears to be standing alone as the best in football this season, the New England Patriots, finally completed their slow rise to the top of the rankings. Admittedly, they were aided by a glitch where their strength of schedule (SOS) got a nice bump from playing a Steelers team, even though it was a shadow of the normal personnel Pittsburgh usually plays. The Patriots deserve to be the top-ranked team. They have one of the league’s most efficient and balanced offenses, piloted by arguably the best player in history, and a stingy defense that keeps opponents out of the end zone. They went 3-1 without Tom Brady. They may not lose a game with him.

Seattle continues a march through an incredibly difficult stretch. No other team this year may face a tougher six games in a row. The upcoming game at New Orleans became more difficult when the Seahawks expended so much energy against the Cardinals. The offense will need to pull their own weight against a potent Saints team that is very tough to beat at home.

  • #3 Atlanta (W 26-24)
  • #9 @ Arizona (T 6-6)
  • #15 @ New Orleans
  • #5 Buffalo
  • #1 @ New England
  • #8 Philadelphia


The Seahawks had the 32nd ranked SOS in last week’s rankings. The improved quality of opponents, and some improved play from past opponents like Miami, has driven up their SOS to 18th. That, more than actual game performance, explains why they team strength + SOS score improved week-over-week. They are a solid offense away from challenging New England for the title, and a good offense away from being the best team in football.

Atlanta continues to ride the best offense in football and a strong SOS to a top ranking. Strip away the SOS, and Atlanta still would rank 6th, so they are not all a product of their opponents. San Diego is a sleeper who has performed well in these rankings all year, even if some of the game results have not gone their way. They have already beaten Denver. Oakland, on the other hand, sits atop the division, but all the way down at 16th in the rankings due to a terrible defense.

Watch out for Tampa Bay, which has climbed 29.8 points over the past three weeks. They have started to find a running game, which has helped both their offense and their defense.


Rankings

Scatter chart

I like this view as it shows tiers of strength that develop over the course of the season.

RANKINGS EXPLAINED

Power rankings are always debatable. I don’t buy into the gut feel methods most places use to determine their rankings, so I developed a formula a few years back that attempts to take at least some of the subjectivity out of the discussion. My approach was simple, I measured offensive and defensive efficiency based on the Yards Per Carry (YPC) and Yards Per Attempt (YPA), as well as points scored and points allowed. The formula to calculate “Team Strength” was as follows:

(YPC (offense) + YPA (offense) + Avg Pts/Game Scored) – (YPC (defense) + YPA (defense)+ Avg Pts/Game Allowed)

The formula has proven to be a pretty accurate predictor of success (roughly 70% of the teams ranked in the Top 10 by week 3 make the playoffs), but I am always looking for ways to improve it. I read a great article on ColdHardFootballFacts.com. There was one gem in there about predicting championship teams. The article mentioned passer rating differential as the “mother of all stats.” A full 69 of 72 champions have ranked in the Top 10 in this statistic. It is a stat after my own heart, as I believe offensive and defensive efficiency is the key measurable outside of point differential. Turnovers would factor in there as well, but I am not convinced a team has as much control over that. My power rankings use YPA and YPC differentials. I went ahead and replaced the YPA with offensive and defensive passer rating, to give me this:

(YPC (offense) + Passer Rating (offense) + Avg Pts/Game Scored) – (OPP YPC (defense) + OPP Passer Rating (defense)+ OPP Avg Pts/Game)

As of September 23, 2014, I have added a strength of schedule component to the rankings as well.
Founder, Editor & Lead Writer
  1. Hi, I found been enjoying your blogs for some time now. It’s clear you put a lot of time and passion into them, thank you!! I’ve been wondering something about the power ratings formula though:

    (YPC (offense) + YPA (offense) + Avg Pts/Game Scored) – (YPC (defense) + YPA (defense)+ Avg Pts/Game Allowed)

    It seems to treat yards and points as having the same rating value. If the offense gains 6 yards, it has improved its rating by the same amount as if they had scored a touchdown. Is that intended? It seems like there should be some sort of multiplier on the Avg Pts/Game Scored to make 1 point be worth more than 1 yard, am I wrong about that?

    1. Fair question. You are actually referencing the old formula. Read a bit further down and you see the latest which relies on passer rating differential instead of yards per attempt. Still, I see it more that point differential and yardage differential are treated at equal value in the old formula. Points can be tricky, and hide underlying strengths or weaknesses that yardage reveals.

  2. You have the Cowboys at number 11? I agree with the everyone has an opinion debate. There is no way anyone can put 10 teams ahead of these 5-1 Dallas Cowboys who happen to be playing strong, smart, and dominant Football. No offense but I have to question you’re football IQ. In fact, my opinion… This isn’t for you. The whole NFL analysis thing buddy. When you place a team that hasn’t lost since week one and has destroyed every team they have played since… Mostly respectable teams with above .500 records outside the top 10 when no one else has them outside the top 5 and most have them in the top 3 and at 2… But this genius has them at number 11… Retire!

    1. Saying “No offense” does not grant you the right to insult folks. That aside, I’m happy to answer your question. Dallas has the 28th ranked strength of schedule in the NFL. They lost to the Giants, and beat Washington, Chicago, San Francisco, Cincinnati, and Green Bay. Not exactly Murderer’s Row. Only Green Bay (4-2) and Washington are above .500 (4-3). The rankings penalize them for getting their numbers against objectively weak competition. Even the Packers are a mediocre team this year so far (19th in these rankings). The other thing holding Dallas back is their atrocious pass defense. They are surrendering a 95.0 passer rating thus far, which dulls the benefit of the great passer rating Dak Prescott has recorded.

      These rankings are about measuring the efficiency of a team, which includes offense, defense and SOS. 70% of the teams ranked in the top ten by week three make the playoffs. It is not perfect. It does have a darn good track record. Feel free to propose a better formula or create one yourself.

    2. Look, I’m not going comment on Brian’s ‘football IQ’, but I will say that this is the results of his formula. This isn’t him pulling a Peter King and just arbitrarily ranking the teams according to his thoughts and whims and biases. This is literally just the results the formula spits out.

      You can debate the formula all you want, but he’s not playing with the order or down-ranking teams he doesn’t like or anything like that. The Cowboys may be a top 5 team, they’re certainly winning like it, but in this formula, they’re not rewarded for winning big against mostly crappy teams. They’ve won, but they should have won. If they keep winning, they’ll rise in these rankings when they start playing some real teams (or they’ll stay a bit lower because they don’t play any real teams).

      I mean, objectively it makes sense that if you go 5-1 against shitty teams, you’re not necessarily better than a team that goes 3-3 and plays 4 or 5 of the top teams in the league. The same goes for going 13-3 against the league’s easier schedules versus a team that goes through a gauntlet and comes out 11-5. This formula is an attempt to compare apples to apples instead of just looking at record (which is apples to oranges, since everyone plays different teams and home vs road).

      Like Brian said, suggest a new formula, but don’t accuse him of bias here, these are literally numbers coming out of an equation. . .

Comments are closed.