NEW RANKINGS FORMULA
I rarely tinker with my rankings formula. It has proven a useful indicator of team strength, even early in the season. A few years ago I replaced yards per attempt with passer rating because of the historical significance of passer rating differential when it comes to Super Bowl winners. I also liked that it was a more holistic measure of offensive and defensive pass efficiency. More recently, I added in strength of schedule (SOS) because performance without consideration of who it was achieved against is only part of the story. I was not entirely satisfied with the formula because it left the run game almost irrelevant to the rankings.
Passer ratings range from the 60s to over 100. Yards per carry in the running game range from 2.0 to 6.0. Leaving those two numbers unweighted basically meant the running game was about 10X less important, which I don’t believe to be true. That was demonstrated this season as a team like Dallas was consistently outside the top ten in the rankings until last week. Much of that was due to their SOS being among the worst in football, but their strong run game was not getting the credit it deserved.
I’ve updated my rankings formula to increase the weighting on the run game. I will make the previous formula results available each week for the next three weeks as a comparison, and then will phase those out. Enjoy.
POWER RANKINGS
Seattle has pulled off a stunning run through some of the top-ranked teams in the league:
- #3 Atlanta (W 26-24)
- #8 @ Arizona (T 6-6)
- #6 @ New Orleans (L 25-20)
- #4 Buffalo (W 31-25)
- #1 @ New England (W 31-24)
- #12 Philadelphia (W 26-15)
To put that in perspective, the Cowboys toughest opponent of the year was the Seahawks weakest opponent in that stretch. Seattle has now played six of the nine possible top ten opponents (they cannot play themselves), and seven of the eleven possible top twelve. The increase in run significance for the formula has no impact on the Seahawks as they allow the same yards per carry (3.5) as they earn on offense. That makes for a differential of zero, which does not change no matter how much you multiply it by.
The biggest thing holding the Seahawks back from the top spot is their scoring differential. It is rather pedestrian (21.9 – 17.3). Championship teams tend to be more in the 7-10+ point differential space. The Patriots, for example, are +9.1 in points per game. Dallas is at nearly +10 (28.5 – 18.7).
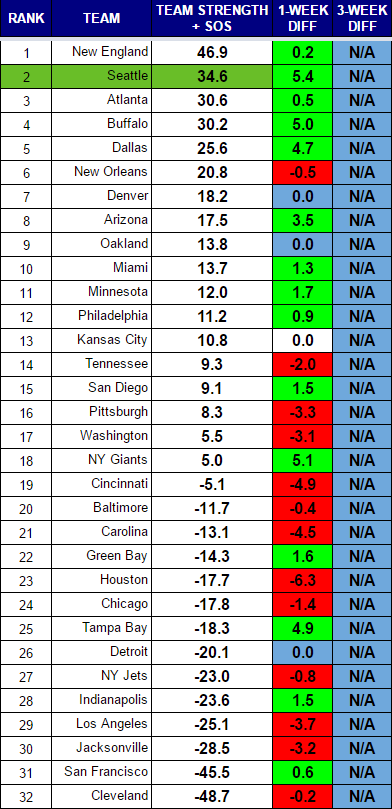
The Cowboys benefit from the increased emphasis on running, as they go from what would have been a #8 ranking to a #5 ranking. You might expect a bigger jump given their powerhouse running offense, but their run defense is not that great, so their differential is not dominating (4.7 YPC – 4.2 YPC). Tennessee also benefits from the change, as they rise from #17 to #14. Buffalo goes from #7 to #4 with their league-best run offense and a relatively stingy run defense.
The Bills are also lifted by the toughest SOS in the league. They have earned their numbers against some of the toughest teams in football. Similarly, the Saints are aided by a strong SOS.
Two things are really holding the Cowboys back from rising higher. First, their SOS. Take that out of the equation and they are the second-ranked team in this new formula. Second, their defense is suspect. They are allowing nearly a 100.0 passer rating (99.3) and 4.2 yards per carry. If they were even league average in defensive passer rating, they would jump in the rankings. They are not, so they do not.
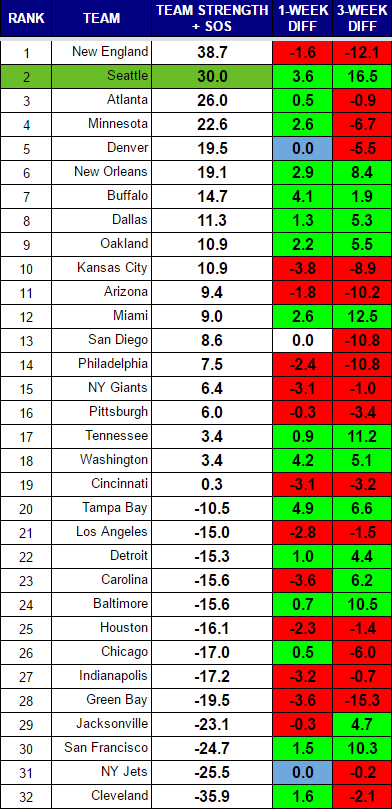
Minnesota is a team who is really hurt by the new formula. Their historically bad run offense drags them down from what would have been a #4 ranking, all the way down to the 11th spot. That feels right.
Watch out for Miami, who climbs to #10 in the rankings.
New Rankings Formula (increased run weighting)
Old Rankings Formula (minimal run weighting)
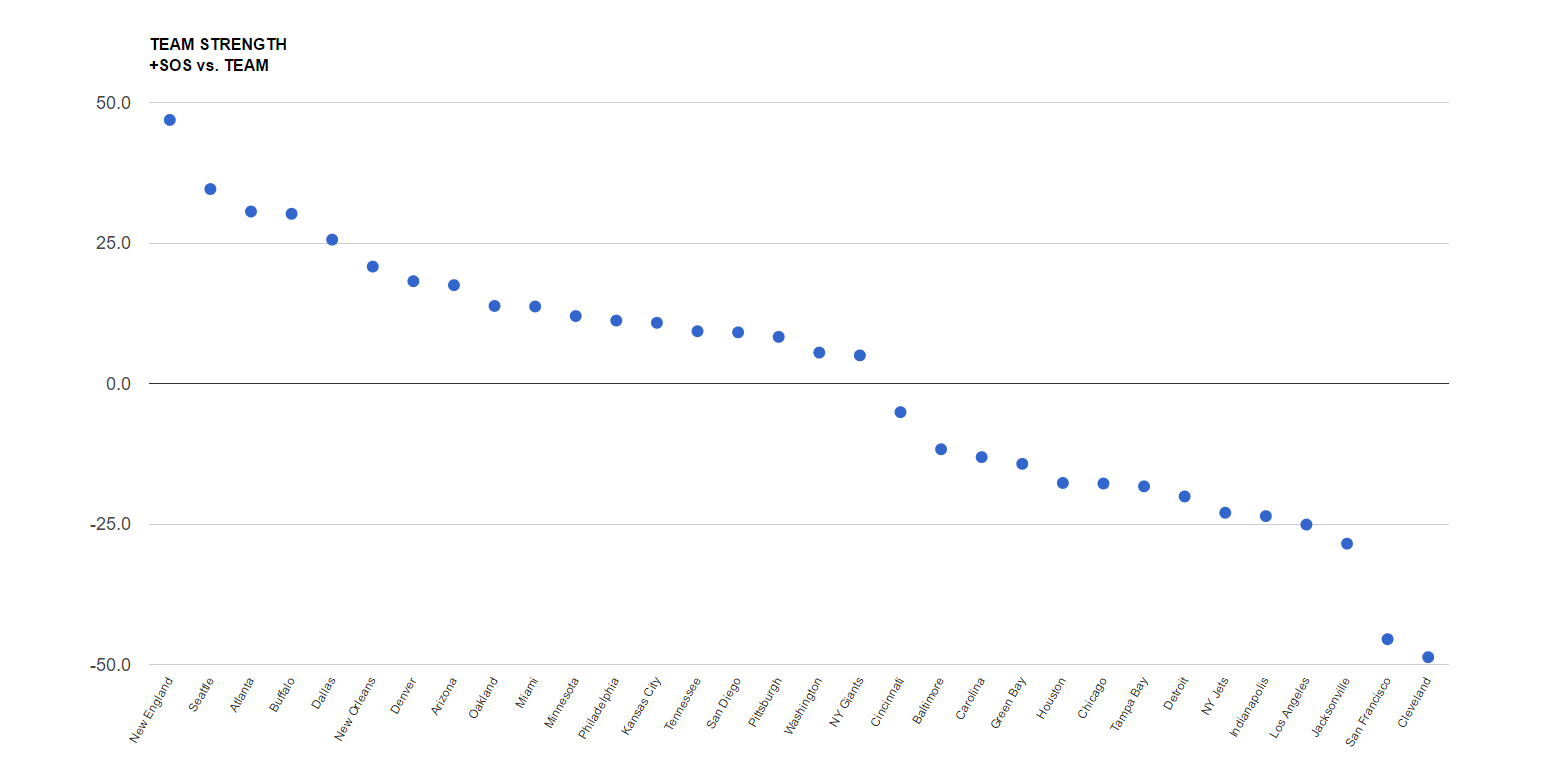
Scatter chart (based on new formula)
I like this view as it shows tiers of strength that develop over the course of the season.
RANKINGS EXPLAINED
Power rankings are always debatable. I don’t buy into the gut feel methods most places use to determine their rankings, so I developed a formula a few years back that attempts to take at least some of the subjectivity out of the discussion. My approach was simple, I measured offensive and defensive efficiency based on the Yards Per Carry (YPC) and Yards Per Attempt (YPA), as well as points scored and points allowed. The formula to calculate “Team Strength” was as follows:
(YPC (offense) + YPA (offense) + Avg Pts/Game Scored) – (YPC (defense) + YPA (defense)+ Avg Pts/Game Allowed)
The formula has proven to be a pretty accurate predictor of success (roughly 70% of the teams ranked in the Top 10 by week 3 make the playoffs), but I am always looking for ways to improve it. I read a great article on ColdHardFootballFacts.com. There was one gem in there about predicting championship teams. The article mentioned passer rating differential as the “mother of all stats.” A full 69 of 72 champions have ranked in the Top 10 in this statistic. It is a stat after my own heart, as I believe offensive and defensive efficiency is the key measurable outside of point differential. Turnovers would factor in there as well, but I am not convinced a team has as much control over that. My power rankings use YPA and YPC differentials. I went ahead and replaced the YPA with offensive and defensive passer rating, to give me this:
(YPC (offense) + Passer Rating (offense) + Avg Pts/Game Scored) – (OPP YPC (defense) + OPP Passer Rating (defense)+ OPP Avg Pts/Game)