POWER RANKINGS
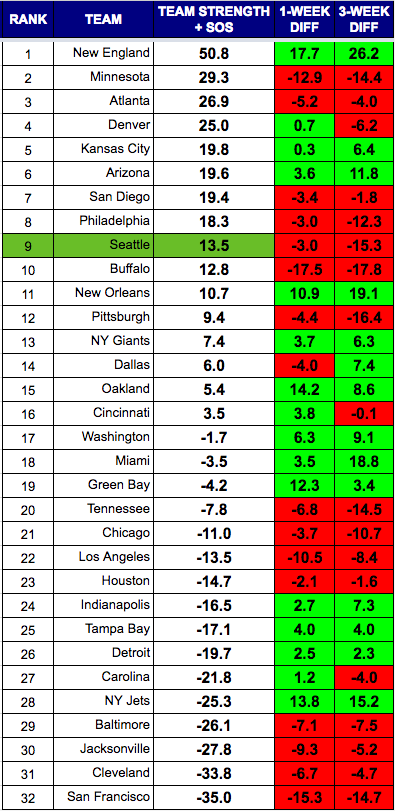
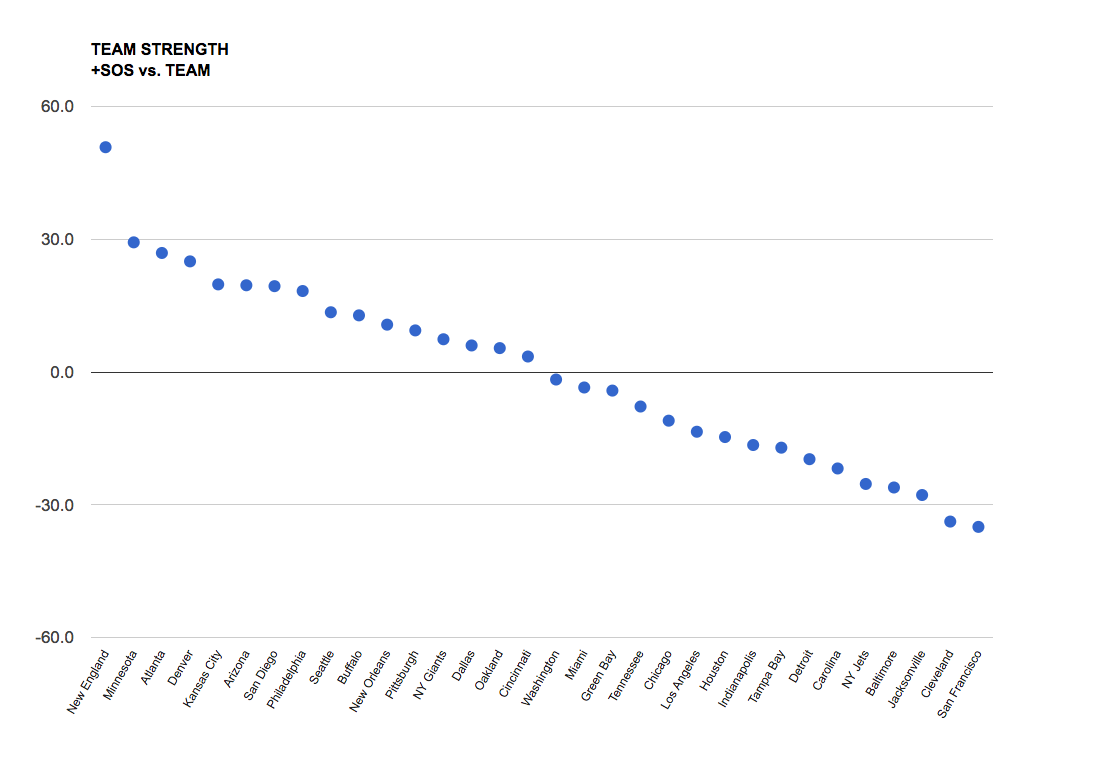
As you scan down to the scatter chart below, you will see how clearly the Patriots have separated themselves from the rest of the league. There is no team close to them. The trade of Jamie Collins was an interesting one, to be sure, but that offense may get even better when Dion Lewis returns shortly.
Minnesota, Atlanta, and Denver form the next tier of strength. The Vikings and the Broncos do it on the backs of great defenses, while the Falcons still have the league’s most potent offense and a bruising strength of schedule (SOS) that bumps them up further.
Kansas City, Arizona, San Diego, and Philadelphia make up the next group. The Cardinals and the Chargers stand out given their below .500 records. Arizona ranks this well due to a terrific defense, strong passer rating differential, and decent point differential. San Diego is artificially inflated due to SOS. The combination of their high ranking and the Cowboys low ranking has me considering adjusting the SOS weighting in the formula.
Even if we remove SOS entirely from the equation, though, the Cowboys would only rank eighth, with the same team strength as the Seahawks. Dallas is the most controversial ranking here due to their sterling 6-1 record. That is because their defense gives up a terrible 94.1 passer rating to opponents. The formula also devalues running compared to passing offense. The Cowboys are obviously terrific at running the ball, but the fact that their defense is not great at defending the run hurts their ranking. Keep in mind, this formula rewards teams that are strong on both sides of the ball. Dallas has a good, not great, offense and a below average defense.
If it makes Cowboys fans feel any better, consider that the Raiders actually have a more highly ranked offense and have faced a tougher schedule, but are still ranked below Dallas due to a one of the worst defenses in the NFL.
Seattle is clawing their way through a brutal stretch. Fans saw a 2-4 Saints team that was embarrassing to lose to. The rankings saw a nearly top ten team winning at home. The Saints offense is elite, behind only the Patriots and Falcons. They have also had one of the toughest SOS rankings so far. They are a sleeper to challenge the Falcons in that division.
- #3 Atlanta (W 26-24)
- #6 @ Arizona (T 6-6)
- #11 @ New Orleans (L 25-20)
- #10 Buffalo
- #1 @ New England
- #8 Philadelphia
It won’t get any easier for Seattle, who plays three straight top ten teams in the next three weeks. The good news will be two home games in that run.
Rankings
Scatter chart
I like this view as it shows tiers of strength that develop over the course of the season.
RANKINGS EXPLAINED
Power rankings are always debatable. I don’t buy into the gut feel methods most places use to determine their rankings, so I developed a formula a few years back that attempts to take at least some of the subjectivity out of the discussion. My approach was simple, I measured offensive and defensive efficiency based on the Yards Per Carry (YPC) and Yards Per Attempt (YPA), as well as points scored and points allowed. The formula to calculate “Team Strength” was as follows:
(YPC (offense) + YPA (offense) + Avg Pts/Game Scored) – (YPC (defense) + YPA (defense)+ Avg Pts/Game Allowed)
The formula has proven to be a pretty accurate predictor of success (roughly 70% of the teams ranked in the Top 10 by week 3 make the playoffs), but I am always looking for ways to improve it. I read a great article on ColdHardFootballFacts.com. There was one gem in there about predicting championship teams. The article mentioned passer rating differential as the “mother of all stats.” A full 69 of 72 champions have ranked in the Top 10 in this statistic. It is a stat after my own heart, as I believe offensive and defensive efficiency is the key measurable outside of point differential. Turnovers would factor in there as well, but I am not convinced a team has as much control over that. My power rankings use YPA and YPC differentials. I went ahead and replaced the YPA with offensive and defensive passer rating, to give me this:
(YPC (offense) + Passer Rating (offense) + Avg Pts/Game Scored) – (OPP YPC (defense) + OPP Passer Rating (defense)+ OPP Avg Pts/Game)