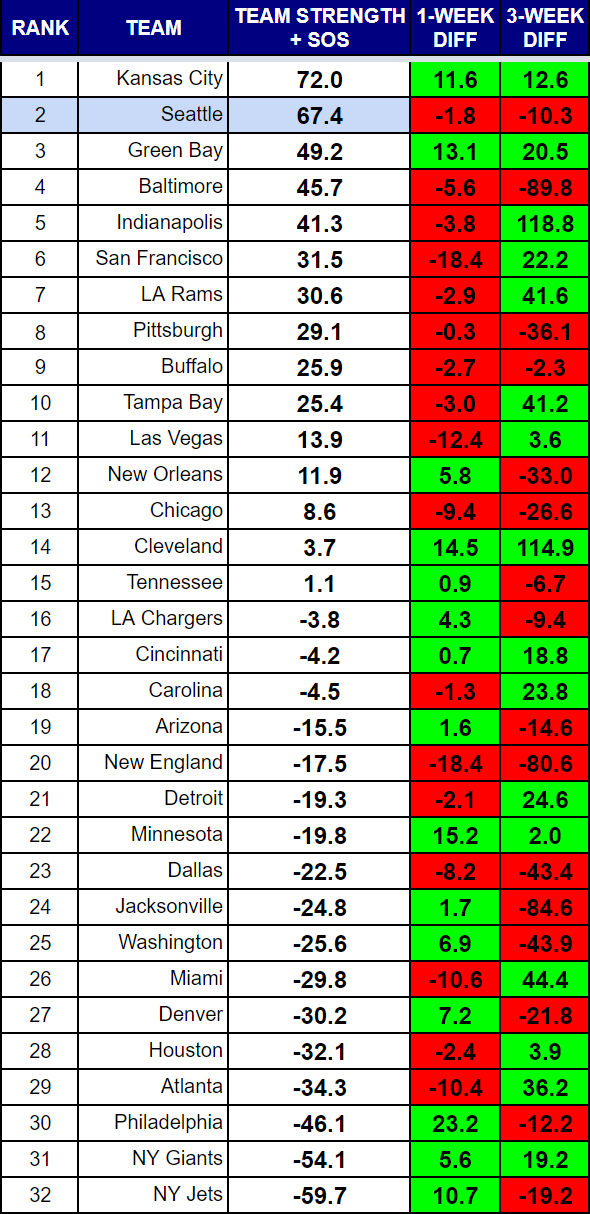
Seattle earned the top spot in these rankings for the first time in years last week. In one way, they are still on top if you remove strength of schedule from the formula. In another, more accurate way, the Kansas City Chiefs rise to number one for the first time this year.
The Chiefs have faced the second toughest schedule so far, according to the SOS, while the Seahawks are in the middle of the pack. The SOS calculation does not take into account injury, so it has no idea the Patriots were without Cam Newton last night or that he played against Seattle.
But how much difference really is there between Brian Hoyer and Newton, right?
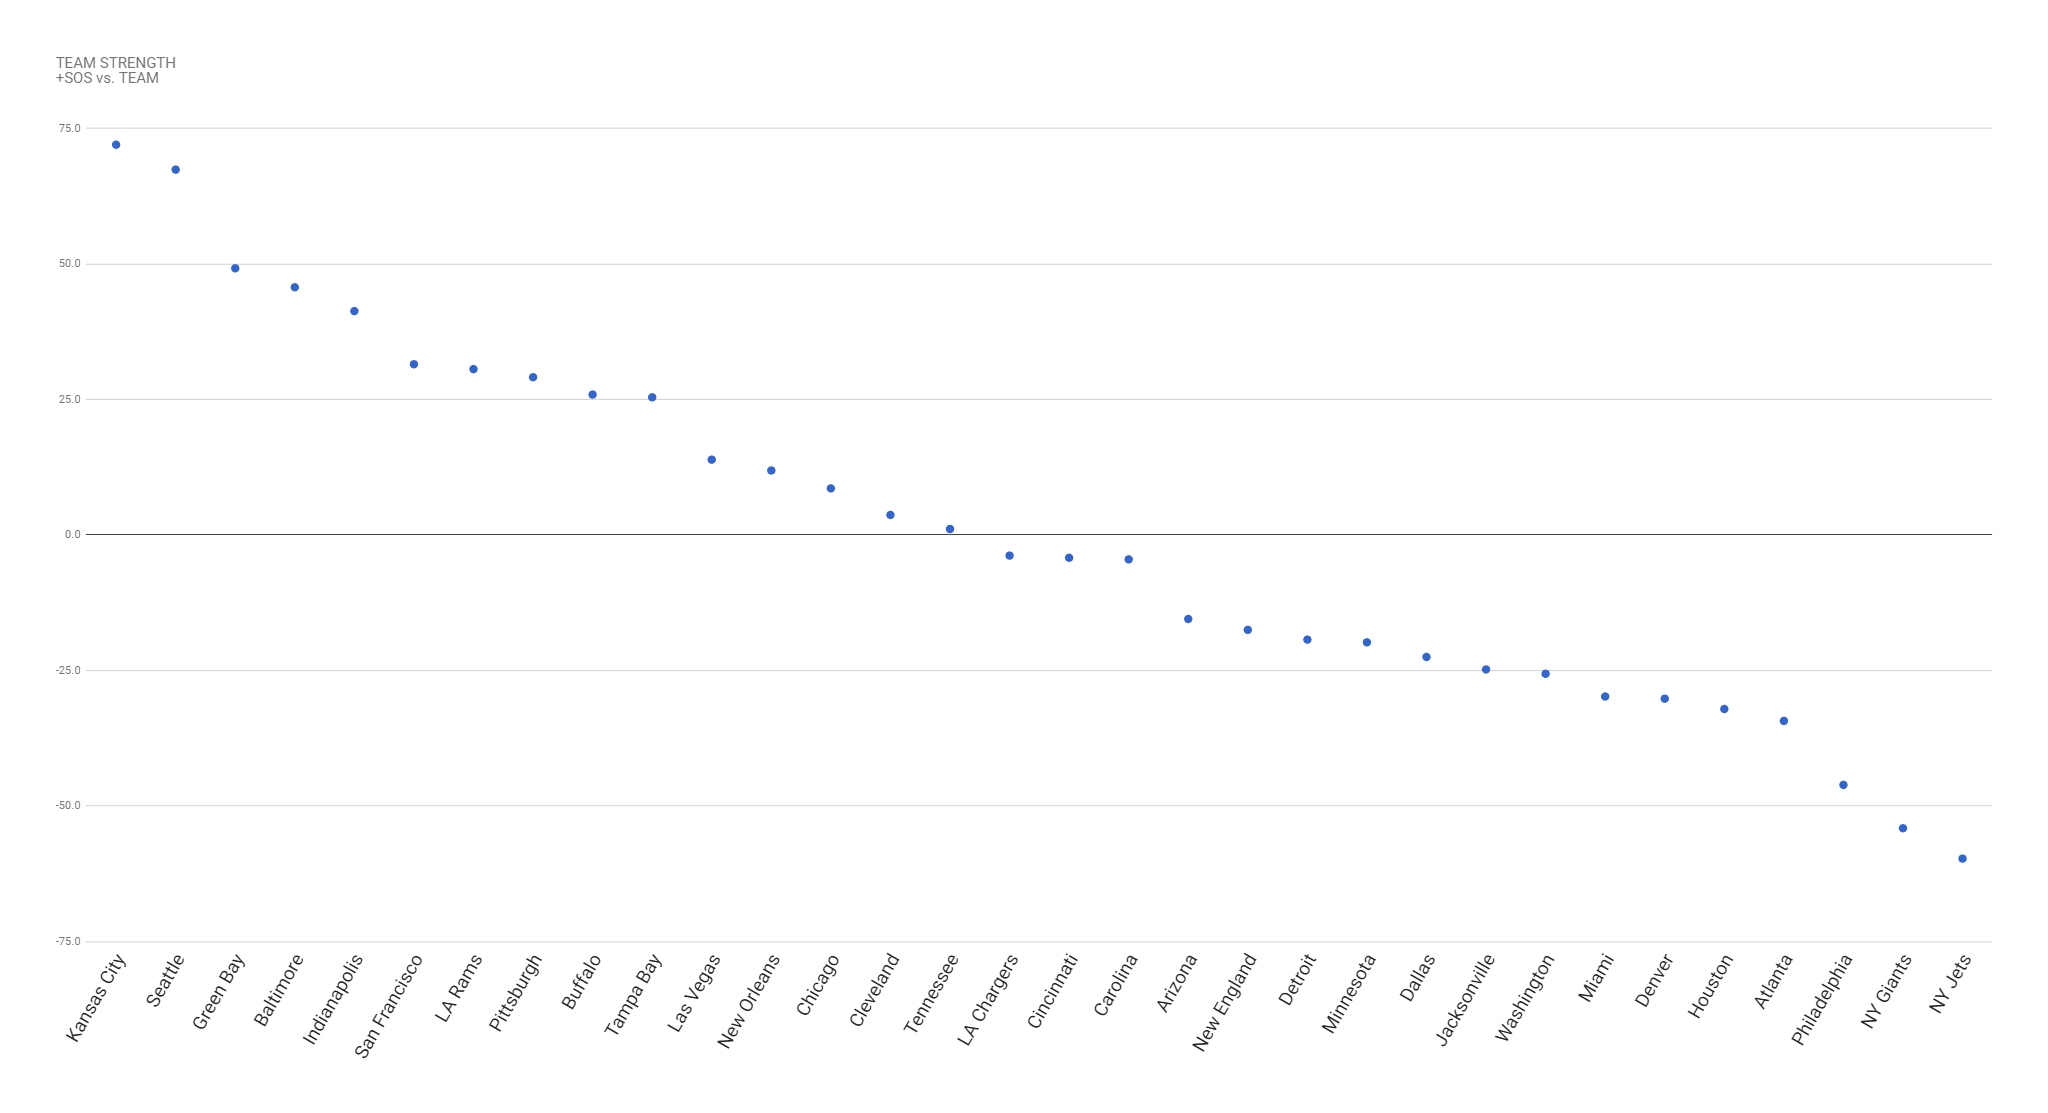
Even if you remove SOS, the Chiefs and Seahawks are the clear front-runners. You can see in the scatter chart later in the article that they are playing at a different level than other squads.
Seeing the Packers that far off was surprising. Their SOS is not great, and their defense is significantly worse than Seattle’s. They are giving up a 107.2 passer rating to opponents and nearly 5 yards per rush.
They are scoring more points per game than Seattle, but even that is a bit of an illusion as the scoring averages are much closer if you strip out non-offensive touchdowns.
The Colts would actually be third if SOS was not a factor. Only San Francisco has faced an easier schedule. Indy is one to watch, especially when they face stiffer competition.
San Francisco is still benefiting from the afterglow of two blowouts versus the Jets and Giants. Their scoring differential is still nearly +10 points per game. Seattle’s is only +8 per game.
The Rams are making their presence felt, and are among the biggest risers since the season started, along with the Bucs.
Check out the Browns at 14. Not sure I remember ever seeing them that high.
The NFC West is going to be fascinating once division play starts.
Rankings Visualization
This view shows tiers of strength that develop over the course of the season.
RANKINGS EXPLAINED
Power rankings are always debatable. I don’t buy into the gut feel methods most places use to determine their rankings, so I developed a formula a few years back that attempts to take at least some of the subjectivity out of the discussion. My approach was simple, I measured offensive and defensive efficiency based on the Yards Per Carry (YPC) and Yards Per Attempt (YPA), as well as points scored and points allowed. The formula to calculate “Team Strength” was as follows:
(YPC (offense) + YPA (offense) + Avg Pts/Game Scored) – (YPC (defense) + YPA (defense)+ Avg Pts/Game Allowed)
The formula has proven to be a pretty accurate predictor of success (roughly 70% of the teams ranked in the Top 10 by week 3 make the playoffs), but I am always looking for ways to improve it. I read a great article on ColdHardFootballFacts.com. There was one gem in there about predicting championship teams. The article mentioned passer rating differential as the “mother of all stats.” A full 69 of 72 champions have ranked in the Top 10 in this statistic. It is a stat after my own heart, as I believe offensive and defensive efficiency is the key measurable outside of point differential. Turnovers would factor in there as well, but I am not convinced a team has as much control over that. My power rankings use YPA and YPC differentials. I went ahead and replaced the YPA with offensive and defensive passer rating, to give me this:
(YPC (offense) + Passer Rating (offense) + Avg Pts/Game Scored) – (OPP YPC (defense) + OPP Passer Rating (defense)+ OPP Avg Pts/Game) As of September 23, 2014, I have added a strength of schedule component to the rankings as well. As of November 22, 2016, I have increased the weighting of the run game and point differential. Yards per carry will be multiplied by 10 to make it more evenly weighted with the passer rating. It is still roughly half as important, but will have a greater impact. Point differential will be multiplied by two as it still should be among the most important aspects of measuring teams.