I missed posting these rankings last week, but it is no surprise that the Seahawks fell from the top spot after losing in gory fashion to the Cardinals. The one-week difference column is really a two-week difference, for those scoring at home.
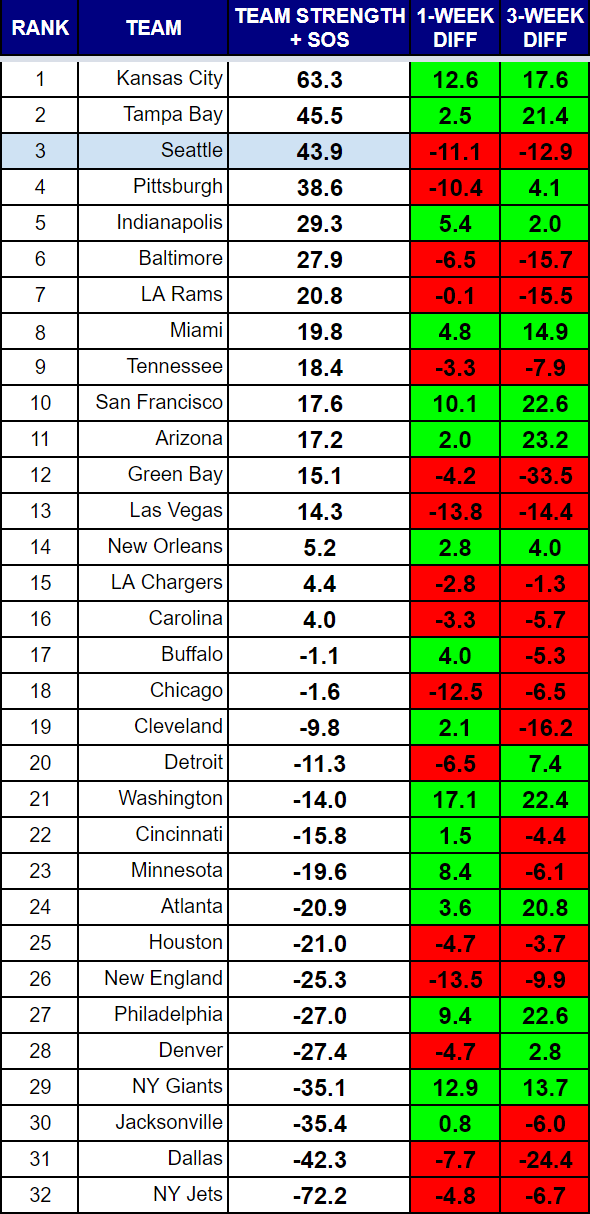
The Chiefs have surged into the top spot and the Seahawks have slid. Kansas City has even had a slightly tougher schedule so far. Tampa has also overtaken Seattle by a slim margin. The Seahawks have a better team strength, but SOS is in the Bucs favor, which pushes them over Seattle.
The Seahawks defense is bad, but there are a number of defenses that are worse this year. Green Bay has one of them. The Packers are allowing opponent passers an average of a 109.8 passer rating, and giving up 4.7 yards per rush. That was manageable when the Packers were averaging close to 40 points per game, but losing their left tackle for a few weeks and their second receiver may have slowed them down.
Miami has steadily climbed into the top ten. Their defense has led the way, but it will be challenging for that offense with what appears to be a rookie quarterback in need of significant development.
You may be wondering how the NFL’s only undefeated team is fourth in these rankings. Pittsburgh has a great point differential of roughly +10 per game. Their defense is among the best in football. Their offense scores 30 points per game. Where they lack a bit is the efficiency of their offense. Their passer rating differential is +19 compared to +28 for a team like the Seahawks or +39 for the Chiefs. Their rushing differential is also only +0.1 versus +1.1 for Seattle and +0.8 for Tampa.
I would not be worried as a Steelers fan. They have a great winning formula. It is just not as favored by the way these rankings are calculated.
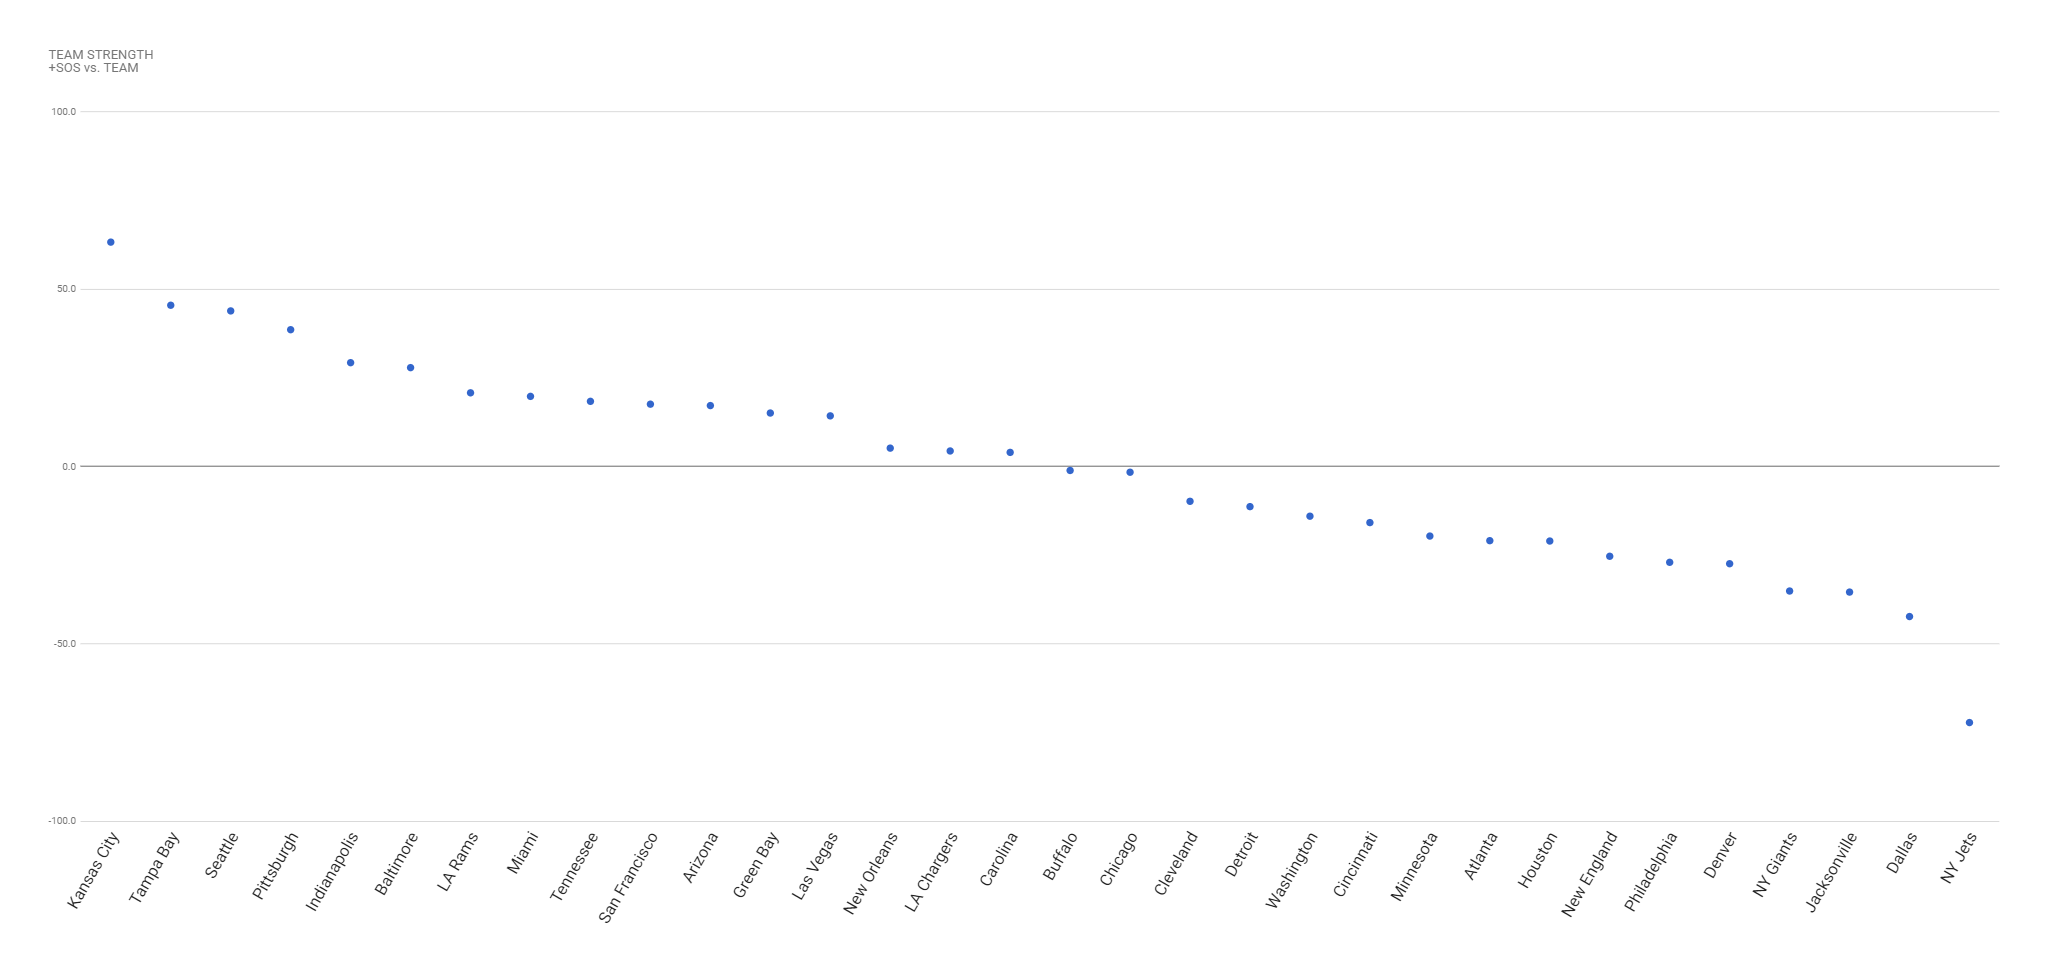
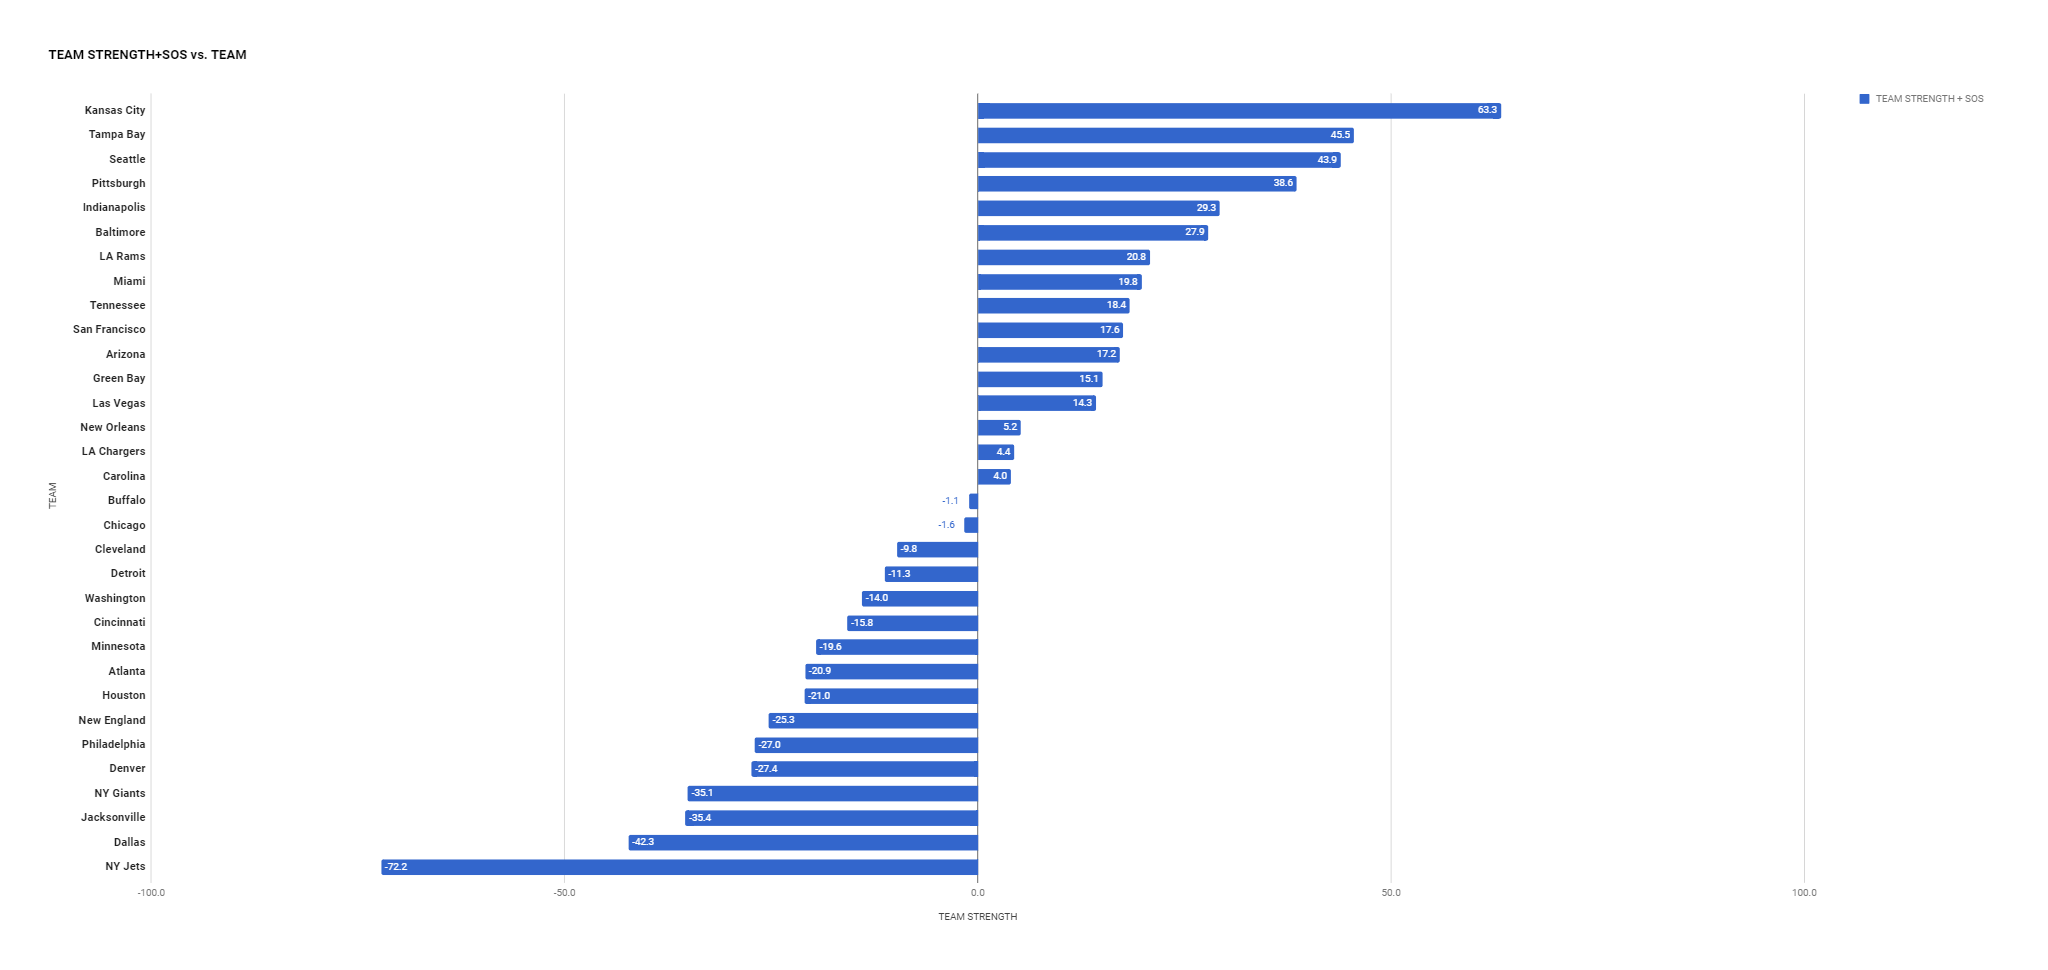
Rankings Visualization
This view shows tiers of strength that develop over the course of the season.
RANKINGS EXPLAINED
Power rankings are always debatable. I don’t buy into the gut feel methods most places use to determine their rankings, so I developed a formula a few years back that attempts to take at least some of the subjectivity out of the discussion. My approach was simple, I measured offensive and defensive efficiency based on the Yards Per Carry (YPC) and Yards Per Attempt (YPA), as well as points scored and points allowed. The formula to calculate “Team Strength” was as follows:
(YPC (offense) + YPA (offense) + Avg Pts/Game Scored) – (YPC (defense) + YPA (defense)+ Avg Pts/Game Allowed)
The formula has proven to be a pretty accurate predictor of success (roughly 70% of the teams ranked in the Top 10 by week 3 make the playoffs), but I am always looking for ways to improve it. I read a great article on ColdHardFootballFacts.com. There was one gem in there about predicting championship teams. The article mentioned passer rating differential as the “mother of all stats.” A full 69 of 72 champions have ranked in the Top 10 in this statistic. It is a stat after my own heart, as I believe offensive and defensive efficiency is the key measurable outside of point differential. Turnovers would factor in there as well, but I am not convinced a team has as much control over that. My power rankings use YPA and YPC differentials. I went ahead and replaced the YPA with offensive and defensive passer rating, to give me this:
(YPC (offense) + Passer Rating (offense) + Avg Pts/Game Scored) – (OPP YPC (defense) + OPP Passer Rating (defense)+ OPP Avg Pts/Game) As of September 23, 2014, I have added a strength of schedule component to the rankings as well. As of November 22, 2016, I have increased the weighting of the run game and point differential. Yards per carry will be multiplied by 10 to make it more evenly weighted with the passer rating. It is still roughly half as important, but will have a greater impact. Point differential will be multiplied by two as it still should be among the most important aspects of measuring teams.