POWER RANKINGS
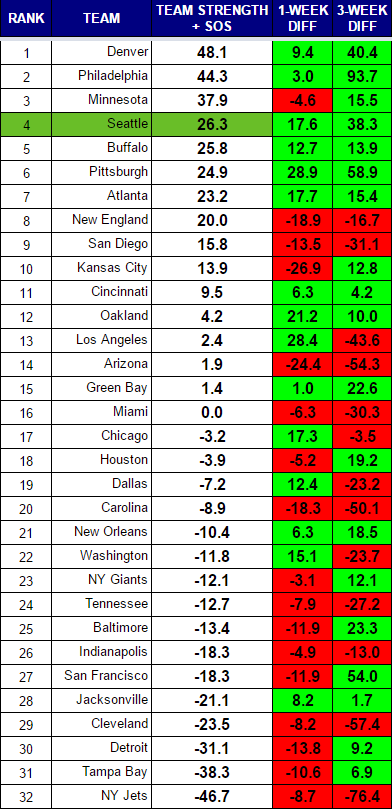
Wheat, meet chaff. Reality is starting to take hold in these power rankings as the top four teams appear to be well suited for a long run this season. The Eagles have a lot left to prove, but holding the Steelers to three points continues to be an impressive feat. The Vikings fall from their top spot this week, but their terrific defense is nothing new. Sam Bradford appears to be the latest quarterback to benefit from Norv Turner’s offense and tutelage. Denver deservedly rises to the top spot. Their defense has been predictably superb and their offense has been surprisingly effective.
Seattle has climbed from 19th to 10th to 4th in the past three weeks. Their ascendancy is stalled only by a bye week. They would rank above the Vikings if strength of schedule was removed. As it stands, the Seahawks have the 27th ranked SOS through four games. That drags them down a bit. It will undoubtedly rise in the coming weeks.
You may be surprised to see the Bills in the top five. Much of that is due to their third-ranked SOS. Playing Arizona at home and Baltimore and New England on the road is relatively tough sledding. That team heads to 13th-ranked Los Angeles this week with their best defensive player, Marcell Dareus, coming off suspension. That Rams team have the look of a paper tiger. They are negative in passer rating differential, yards per carry differential, and point differential through four games. Yet, they are 3-1 with big wins over Seattle and Arizona. If not for their 6th-ranked SOS, they would be in the bottom half of the rankings.
Atlanta will be getting plenty of buzz after scoring a whopping 38 points per game for four weeks. They face among the most grueling tests in the NFL over the next two weeks as they travel to Denver and then to Seattle. Let’s check back on where they rank after those games.
Rankings Table
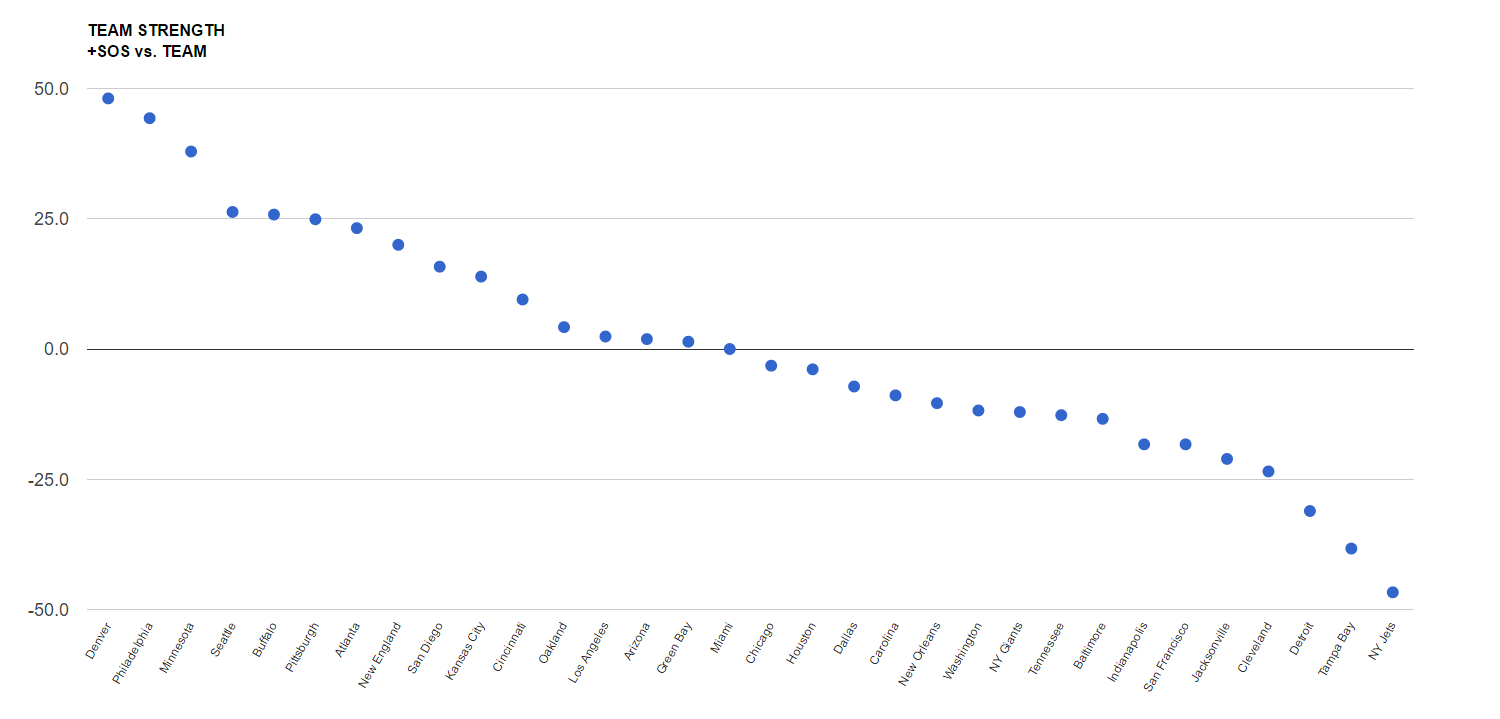
Scatter chart
I like this view as it shows tiers of strength that develop over the course of the season.
RANKINGS EXPLAINED
Power rankings are always debatable. I don’t buy into the gut feel methods most places use to determine their rankings, so I developed a formula a few years back that attempts to take at least some of the subjectivity out of the discussion. My approach was simple, I measured offensive and defensive efficiency based on the Yards Per Carry (YPC) and Yards Per Attempt (YPA), as well as points scored and points allowed. The formula to calculate “Team Strength” was as follows:
(YPC (offense) + YPA (offense) + Avg Pts/Game Scored) – (YPC (defense) + YPA (defense)+ Avg Pts/Game Allowed)
The formula has proven to be a pretty accurate predictor of success (roughly 70% of the teams ranked in the Top 10 by week 3 make the playoffs), but I am always looking for ways to improve it. I read a great article on ColdHardFootballFacts.com. There was one gem in there about predicting championship teams. The article mentioned passer rating differential as the “mother of all stats.” A full 69 of 72 champions have ranked in the Top 10 in this statistic. It is a stat after my own heart, as I believe offensive and defensive efficiency is the key measurable outside of point differential. Turnovers would factor in there as well, but I am not convinced a team has as much control over that. My power rankings use YPA and YPC differentials. I went ahead and replaced the YPA with offensive and defensive passer rating, to give me this:
(YPC (offense) + Passer Rating (offense) + Avg Pts/Game Scored) – (OPP YPC (defense) + OPP Passer Rating (defense)+ OPP Avg Pts/Game)